Water scarcity challenges, extreme drought and increasing competition for water are frequently featured in news headlines – a testimony to, and constant reminder of, the urgency of addressing global water issues. This urgency is further recalled by the United Nations through the adoption of the sustainable development framework in 2015, which includes a dedicated goal (SDG # 6) on water issues.
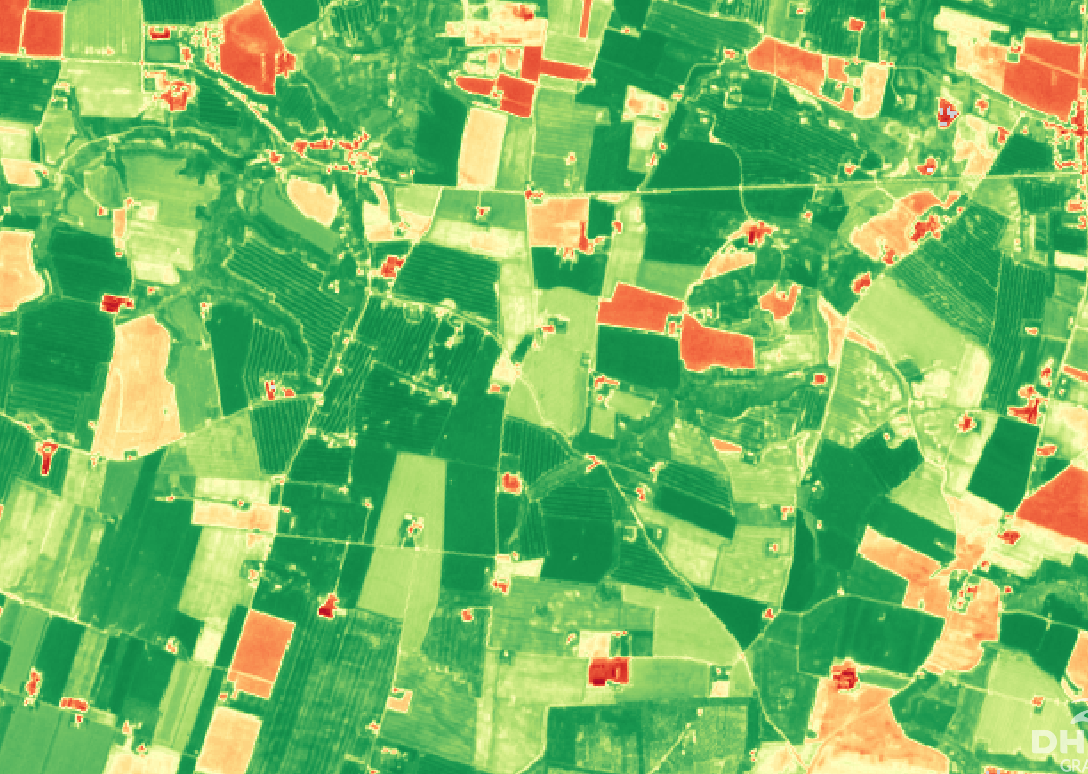
Tools to underpin optimisation of water use productivity are thus instrumental in order to secure sustainable water resource management and ultimately achieve SDG 6. DHI’s satellite-based methodology to derive reliable and timely evapotranspiration estimations at field level provides a vital instrument to support informed decision making of critical water resources. Our novel tool delivers essential information to support water use efficiency within several domains, including irrigation management, by providing an indication of areas where crops experience water stress, as well as water licensing schemes by providing a cost-effective and efficient means to do water accounting.
As a primary outcome of the development efforts conducted through the European Space Agency funded project Sen-ET, we are further evolving our evapotranspiration and crop water needs products into robust applications for water resource management. In a new EU funded project ‘NextLand’ we are exploring new innovative and operational services to strengthen the entire value chain of the agricultural and forestry sector. Through ET4FAO, funded by the @European Space Agency, we are demonstrating the use of our evapotranspiration tool to provide a robust and operational monitoring solution of agricultural water use at continental, national and local levels.
Concurrent to the implementation of Nextland and ET4FAO, we are exploring a number of commercial partnerships with major information providers to the agricultural industry as well as leading irrigation equipment producers.
DHI GRAS to lead efforts to develop global level EO tools and data to strengthen water resource management
29 APRIL 2020
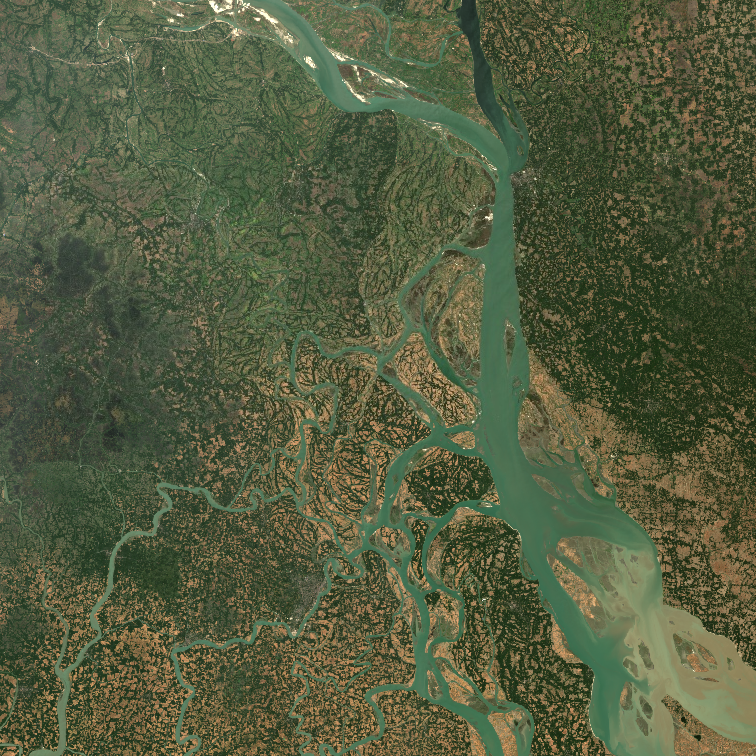
We are delighted to announce that DHI GRAS has been contracted by the European Space Agency (ESA), to lead a consortium consisting of GeoVille GmbH (Austria), GISAT (Czech Republic), GRID-Arendal (Norway) and the technical university of Denmark (DTU), in a large new application project: “WorldWater - Surface Water Dynamics”.
Water is essential for life on Earth and a critical natural resource that underpins all social and economic activity. During the last century, water consumption has increased twice as fast as the world’s population, and today water scarcity affects more than 40 percent of people globally – a disturbing figure which is expected to rise if we do not change our habits and respond to climate change and future global warming.
The dedicated goal on water in the 2030 agenda for sustainable development has brought a spotlight on water policy at global level, and in national planning, to avoid an accelerating ‘water crisis’ towards 2030. However, a ‘water crisis’ is ultimately a management crisis, that can be solved through the application of sound water management policies and initiatives. The need for proper and timely information on water (non-) availability is a critical requirement for water management activities. In large, remote and inaccessible regions, in-situ monitoring of inland waters is sparse, and hydrologic monitoring can significantly benefit from information extracted from satellite earth observation (EO).
Through the lens of Sustainable Development Goal (SDG) 6 and specific use case studies, the WorldWater project will demonstrate how global coverage EO data, can be used to systematically and accurately measure inland surface water resources. WorldWater will complement existing EO initiatives and projects (e.g. Global Surface Water Explore and the Copernicus global land services) by further developing EO tools and products to effectively use the most up to date, open and free satellite data, primarily from the Sentinel missions, for improved monitoring of the world’s inland water resources in both extent and volume.
WorldWater is, therefore, a crucial project aiming to address the critical needs of authorities, at all levels, to adapt and formulate water policies, and report on water resources, in a timely manner and based on valid scientific information. More specifically, WorldWater will provide essential tools and information to strengthen evidence-based planning and management to support authorities in addressing the global ‘water crisis’.
Satellites are playing an important role in efficient management of water resources
17 April 2020
Building on the Sen-ET project led by DHI-GRAS, the European Space Agency (ESA) just published this news story featuring our state-of-the-art technology for deriving accurate measurements of evapotranspiration at parcel level. Our technology enables detection of water stress and irrigation support, at individual field scale, anywhere in the world. Currently, we are supporting irrigation management and precision agriculture activities in five continents. Background The Sentinel-2 and Sentinel-3 satellite constellations have highly suitable spatial, temporal and spectral characteristics for many agricultural applications. This includes estimating water evaporation from the soil and transpiration from the leaves (together called evapotranspiration – ET), the knowledge of which is critical for agricultural water resources management and water use optimization.
In order to robustly model ET, both optical and thermal satellite data are needed. The former data is acquired daily by Sentinel-3 at 300 m resolution and by Sentinel-2 every 3 to 5 days at 10 – 20 m resolution. Thermal data is acquired only by Sentinel-3 at around 1 km resolution. ET estimates derived directly from this thermal data would also have a resolution of “just” 1 km, which would obscure many agricultural landscape features.
This is why DHI GRAS together with IRTA and SANDHOLT worked on developing a method to fuse Sentinel-2 and Sentinel-3 data, with the aim of obtaining ET maps with a resolution of 20 m. This was the primary objective of the Sen-ET project.
Frontline technology for water resource management and irrigation support One application where the Sentinel-based high-resolution actual evapotranspiration (ETa) estimates could be particularly useful is water rights monitoring and water accounting and auditing. Those tasks are sometimes performed at an irrigation district level, but often water use monitoring needs to be undertaken at an agricultural parcel level.
In those cases, the use of high-resolution data is essential. By relying on estimates of ETa, as opposed to potential or reference ET, it is possible to measure water consumption values in a more direct and robust manner. This is because ETa considers the actual water transfer from soil and vegetation into the atmosphere, while potential or reference ET are theoretical maximum values reflecting, respectively, water use of unstressed vegetation or atmospheric demand.
In the video at the bottom of the page we can observe the extra spatial detail which is revealed when using the Sen-ET methodology. At the native resolution of the Sentinel-3 thermal observations’, it is not possible to distinguish any agricultural fields or other landscape features, while at Sentinel-2 spatial resolution all the parcels are clearly visible. Focusing on the pivot irrigation fields in the top-left corner, with fine spatial resolution, we can easily separate both the total ETa of the different fields and the unique temporal pattern of each field (see figure below).
Those estimates can then be compared with either total rainfall values or with ETa of an un-irrigated area, close by, to calculate irrigation water input at parcel level. At coarse spatial resolution, the ETa estimate contains aggregated values from the adjacent fields as well as non-irrigated land in the vicinity of the fields, making such comparison more difficult.
The accuracy of the modeled ETa has been validated extensively in the Sen-ET project. The results indicate an uncertainty of around 30% in herbaceous agricultural fields, such as the irrigation pivot parcels. This number is a result of comparing instantaneous ETa estimates against 30-minutes eddy-covariance flux tower observations. The uncertainty in the flux-tower observations is usually in the order of 20% and this reflects on the satellite-based estimates’ accuracy. In addition, when aggregating the instantaneous estimates to daily, seasonal or yearly values the accuracy increases significantly as it cancels out random errors.
Application potential and way forward Water is essential for life on Earth. Water is a critical natural resource that underpins all social and economic activities. Tools that can underpin further optimisation of water resource use and minimise consumption are instrumental in order to secure sustainable water resource management worldwide. Our cutting-edge methodology to derive reliable and timely ET estimations at field level provides a vital instrument to support informed decision making of critical water resources.
Our method provides critical information to support water use efficiency within several domains, including irrigation management, by providing an indicating of areas where crops experience water stress, as well as water licensing schemes by providing a cost-effective and efficient means to do water accounting.
The development of our state-of-the-art ET tool builds on several years of research led by Dr. Radoslaw Guzinski. Rado (PhD from the University of Copenhagen with a thesis focusing on remote sensing of evapotranspiration) is a Senior Remote Sensing Specialist and Software Engineer with DHI GRAS and was previously a Research Fellow with the European Space Agency (ESA). While at ESA he significantly contributed to the Mission Requirements Document for the proposed Copernicus High Spatio-Temporal Resolution Land Surface Temperature Mission.
For more information about our ET approach and ongoing work, please contact Rado at rmgu@dhigroup.com.
If you would like to know more about how our tool can be put into practice in your company, please reach out to our Business Development Manager, Torsten Bondo at tbon@dhigroup.com
A seesaw between climate extremes - Mapping the Australian flooding’s from space
12 FEBRUARY 2020
Just three weeks ago, we mapped the impacts of the devastating bushfires in Australia, triggered by the driest and hottest year on record. Heavy rainfall over the weekend has been a welcome relief for millions of animals and has helped to subdue some of the fires in New South Wales, however in return, the torrential rain has caused major flooding’s in the coastal regions.
Using our automated satellite-based operational flood mapping tool, we have mapped the extent of the flooding’s in one of the worst affected areas, around the city of Nowra in the Shoalhaven region, just south of Sydney. While the flood map quantifies the severity of the flooding’s, satellite images are also ideally positioned to visualize its effects on the overall water environment, as illustrated in the video.
So while the seesaw of events in Australia is a testimony to the unsustainable trajectory of our planet, we believe we are part of the solution – by bridging critical earth observation data and relevant stakeholders, we enable decision makers to take confirmative actions to respond to the severity of climate change and act upon climate impacts.
Our satellite-based product portfolio are ideally positioned to provide rapid and cost-efficient information about the impact of climate change and climate induced extreme events.
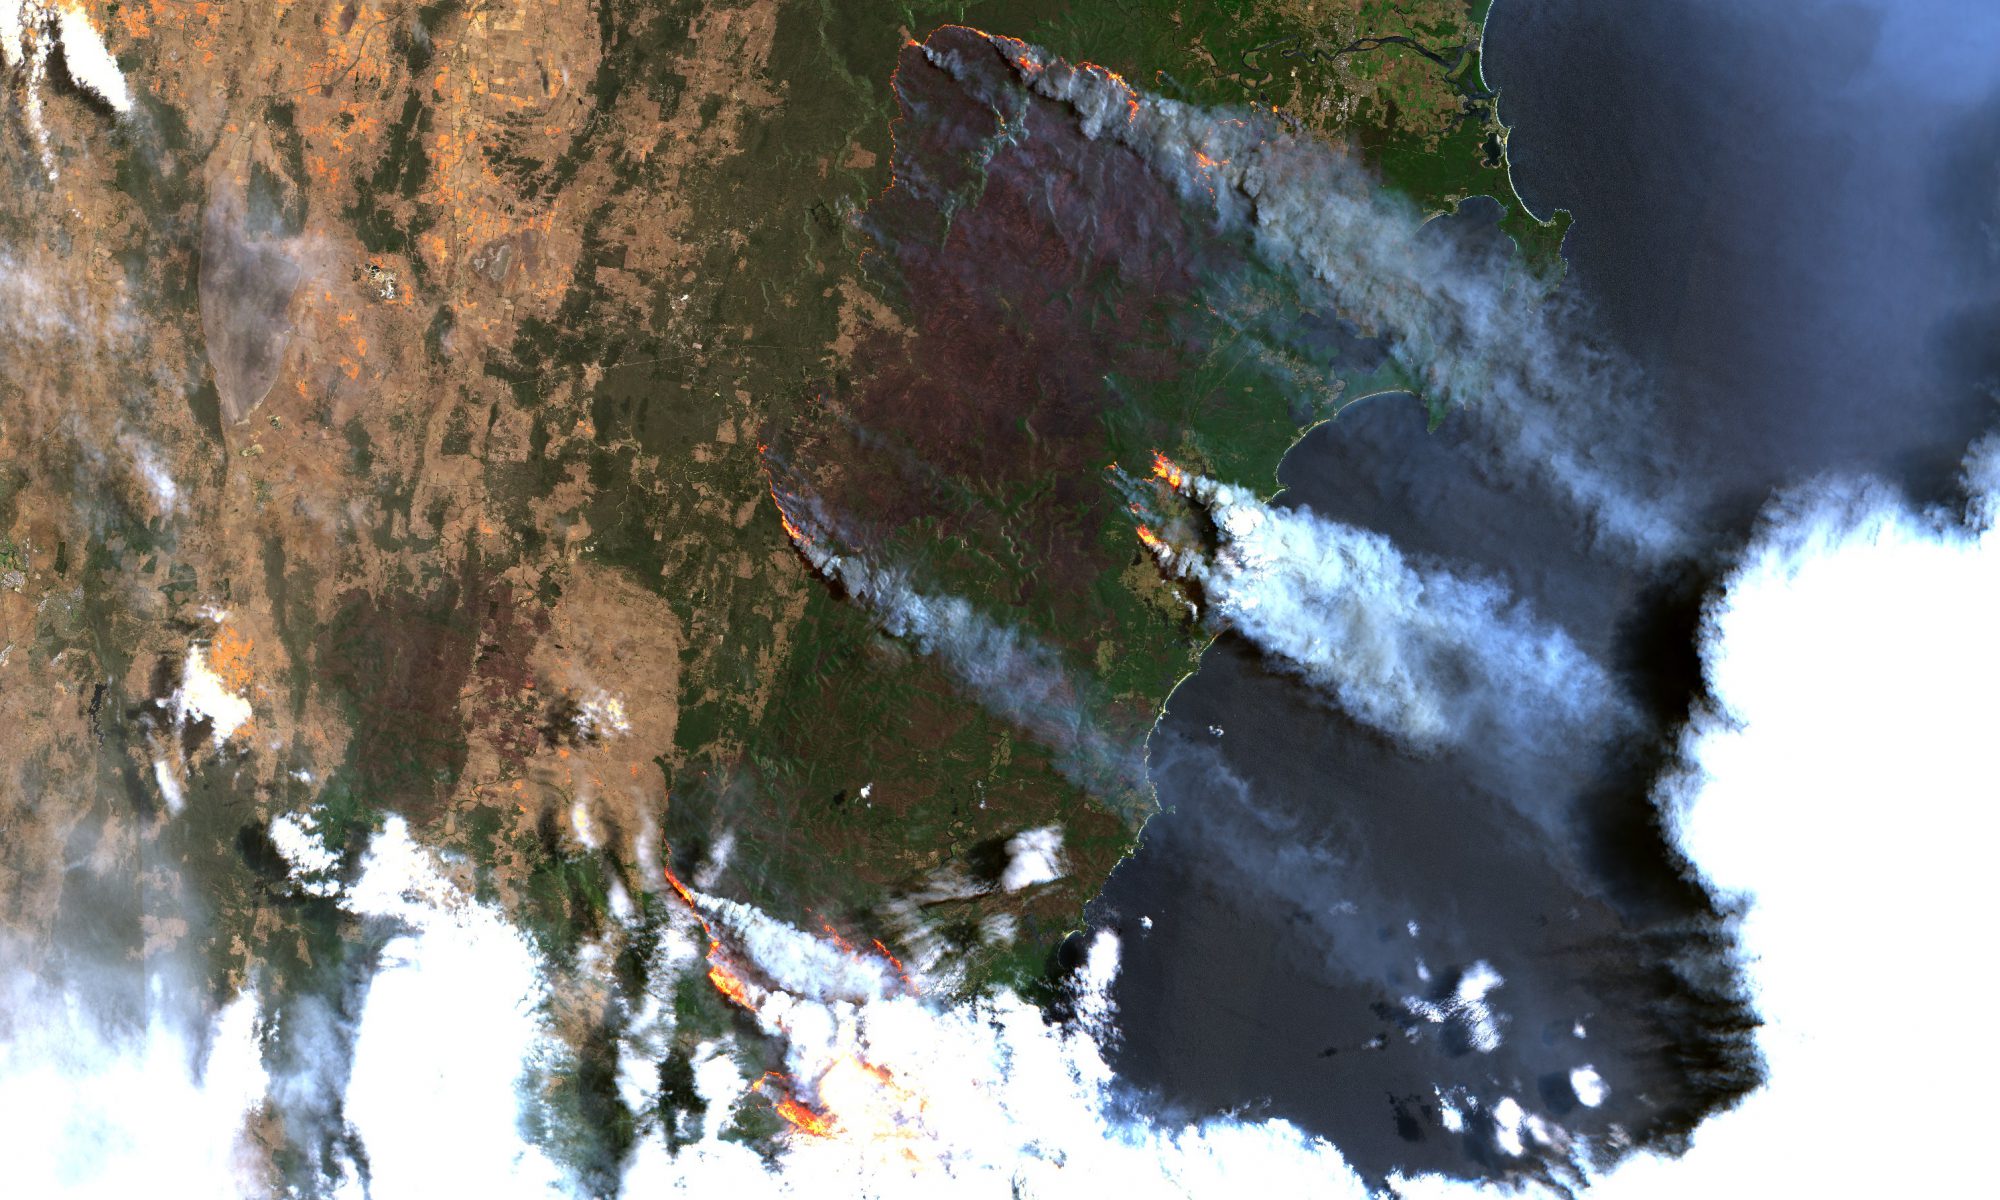
Quantifying the impact of the Australian bushfires from space
16 JANUARY 2020
This year’s fire season in Australia is widely regarded as one of the most severe on record, causing detrimental damage to natural landscapes, wildlife, cities and critical infrastructure across the nation. Using data from NASA's MODIS satellites, we have detected an accumulated quarter of a million km2 affected by active bushfires, during the last two months, more than the total land mass of the United Kingdom.
We are saddened by the ferocious bushfires sweeping across Australia and devoted to continuing to deliver our impactful tools and services to assist authorities in responding and scaling efficiently and effectively during such disaster scenarios. Our satellite-based product portfolio is ideally positioned to provide rapid and cost-efficient information about fire risk, impact and movement, thus offering critical tools for fire response. As an example, our high-resolution soil moisture product can be applied nationwide to conduct largescale assessments of fire risk.
Driven by our passion for change and curiosity about innovative and integrated satellite-based solutions, we continue to explore avenues to support decision makers in making critical evidence-based decisions.
SATELLITE-BASED SOLUTIONS TO SUPPORT THE OFFSHORE WIND INDUSTRY:
20 december 2019
Offshore wind has experienced tremendous growth in recent years as an attractive and clean energy alternative. However rigorous environmental legislation and a harsh and dynamic environment require thorough and meticulous planning as well as continuous operational monitoring of windmill installations and the dynamics of the surrounding water bodies.
The majority of the data and information needed to plan, construct and operate offshore wind farms is costly, time consuming and risky to collect, requiring rigorous field campaigns and expensive equipment.
Cost-effective and reliable solutions from space
Satellite-derived data products and services provide a powerful, low cost and efficient alternative to supplement or replace traditional monitoring solutions, by delivering up to date insight on the dynamics of the seabed and conditions of the environment around offshore wind farms. Our key offerings include satellite-based approaches to map and monitor shallow water bathymetry; aquatic vegetation; geomorphological dynamics and sedimentary variations around offshore wind installations. We also provide critical input data components to support offshore wind cable landfall assessments, such as coastal dynamics, digital terrain models and imagery for site planning.
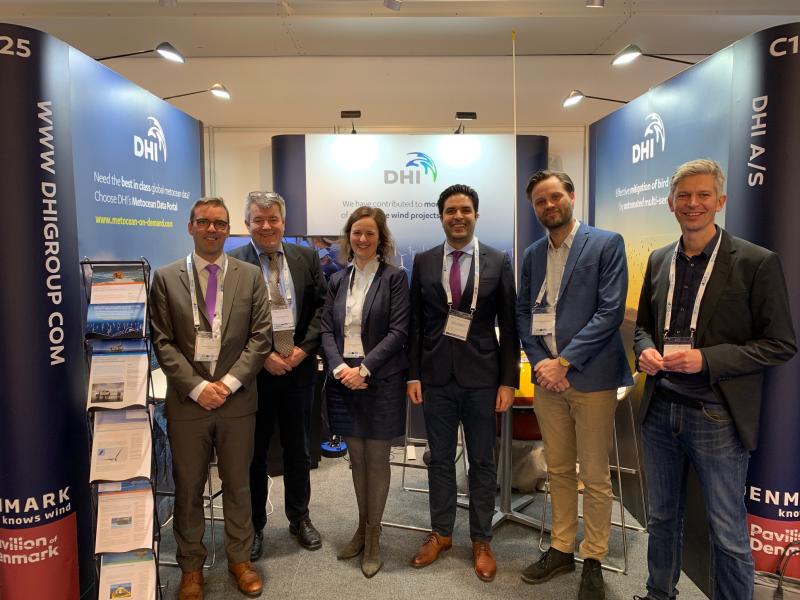
Rasmus Borgstrøm (second from the right) and Torston Bondo (Far right) at WindEurope 2019
Growing interest in satellite-based products among major stakeholders
We have experienced an increased uptake and interest in our products and services, by stakeholders involved in the offshore wind industry, which was most recently solidified at the WindEurope Offshore conference in Copenhagen last month. The conference is a leading platform for peer to peer discussions with industry leaders and specialists and a unique opportunity to grasp the latest industry trends. We were represented by our Managing Director, Rasmus Borgstrøm and Business Development Manager, Torsten Bondo and their discussions with peers, potential clients and collaborators indicates a significant continued interest in our Earth Observation products, designed to support the monitoring needs of offshore wind operators.
Continued engagement with offshore industry partners and clients in 2020
As we are approaching the end of 2019, we are reflecting on an upbeat year where we have been excited to experience this attention and acceptance of our products and services by clients in the offshore wind industry, and we are looking forward to 2020 where we will continue to push our reliable and low-cost tools to support offshore wind farm operations.
See the video to below for further information and insight on how our products match the needs of clients and stakeholders in the offshore wind industry.
Satellite based solutions to map and monitor the distribution of underwater vegetation dynamics in shallow water areas provides a cost-effective and efficient tool for consistent synoptic monitoring of large areas.
Delivering key insight on vegetation status and trends, satellite data provides a critical tool, enabling management authorities and decision-makers in making more effective decisions towards protecting and managing marine environments and resources.
Using high-resolution satellite data, novel machine learning techniques and advanced data processing, we have created the first-ever national overview of the spatial distribution of shallow-water submerged aquatic vegetation in Denmark.
The national map of submerged aquatic vegetation provides an important baseline on the current status of vegetation density in Danish territorial waters. Future efforts will aim to advance the baseline by making continuous assessments on year to year and intra annual variations in vegetation cover at national level.
With an established methodology and a scalable approach in place, satellite data can now be turned in to actionable data and information about the condition and status of submerged aquatic vegetation in shallow water areas, in any part of the world.
Thanks to the VELUX FOUNDATION for their generous grant, which has allowed us to reach this significant milestone.
Visit http://satlas.dk/marine-vegetation/ or click the button below to see the vegetation density map and learn more about satellite-derived aquatic vegetation mapping.
Presenting our satellite-based CAP monitoring solution at MARS 2019
27 NOVEMBER 2019
DHI GRAS is excited to participate in the 25th annual MARS conference this week in Prague, Czech Republic. The conference provides a platform for EU member states to discuss lessons learned and approaches to administer the Integrated Administration and Control System (IACS) under EU’s Common Agricultural Policy (CAP).
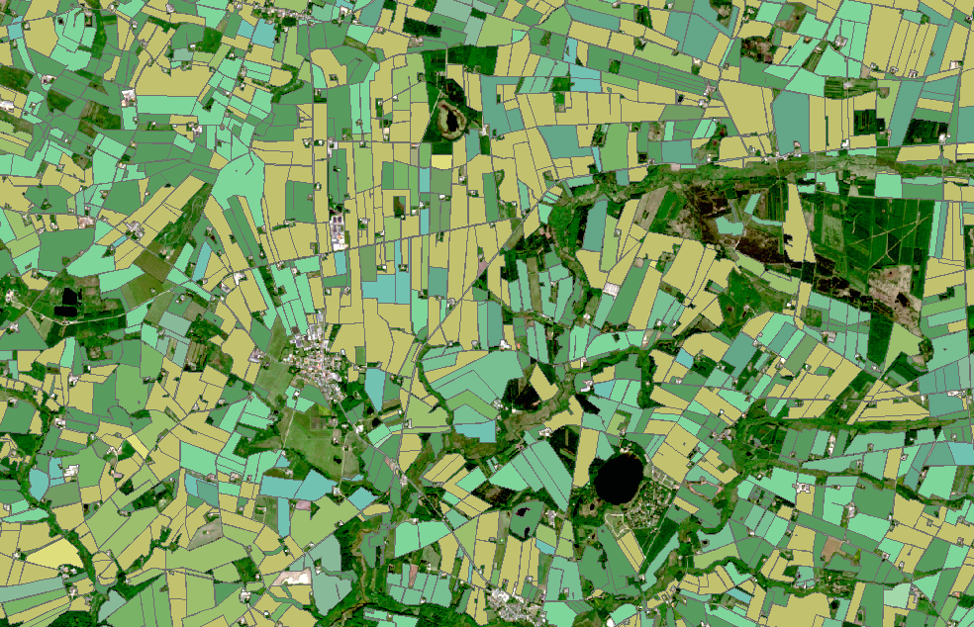
Represented by Kenneth Grogan and Lotte Nyborg, we will present a novel satellite-based approach to underpin the monitoring framework of national paying agencies under CAP2020+. Our solution provides a streamlined and highly accurate monitoring system to check if farmers report correctly on crop types and farm management practices according to the rules, procedures and eligibility requirements under the framework of EU’s CAP policy. The monitoring system has been developed, tested and operationally implemented by the Danish Agricultural Agency (DAA) and provides a streamlined solution to assess farmers applications according to CAP requirements, while at the same time reducing the amount of time spent on control visits.
In brief, our solution consists of:
1) a powerful back-end image processing chain for handling petabytes of satellite data 2) an advanced analytics toolbox for machine learning, deep learning and time series analysis 3) a sleek front-end web viewer for easy presentation of results and reporting.
Operational services are tailored to CAP monitoring needs, including crop type mapping, grassland activity monitoring, detecting harvest and tillage, and monitoring of catch crops.
We have been excited about contributing to shape the new agricultural monitoring practices in Europe and we congratulate the DAA as first movers in the EU to adopt a satellite-based solution to administer CAP monitoring. With our solution we have proved that satellite-services offer a highly accurate and cost-efficient alternative to existing in situ monitoring options and we are excited about our corporation with the DAA, to develop a robust and accurate CAP monitoring system, optimized for local conditions in order to achieve very high accuracies. We will be looking forward to meeting with national authorities and EU policy makers this week in Prague, to discuss how other countries can tap into the services offered by the monitoring system developed for the Danish authorities.
More information about agricultural monitoring at DHI GRAS
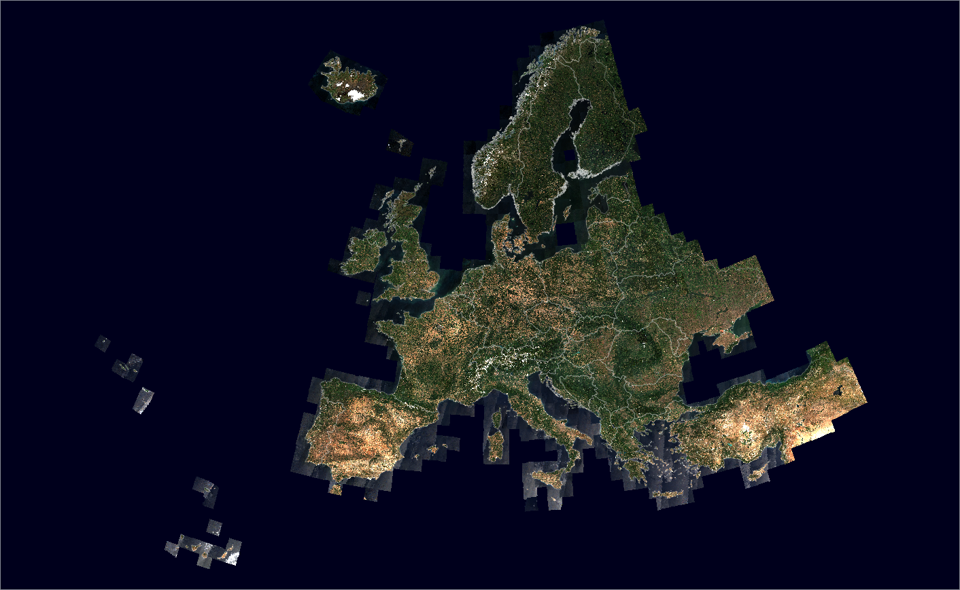
Working with satellite imagery would be much easier if there were no clouds obstructing the view from satellites that orbit the earth far above the clouds.
Luckily, there are several clever ways to solve this problem. One way is to stitch satellite images of the same area together to create a composite.
Composites can be computed for any period of time, e.g. monthly, yearly, and for any area around the world.
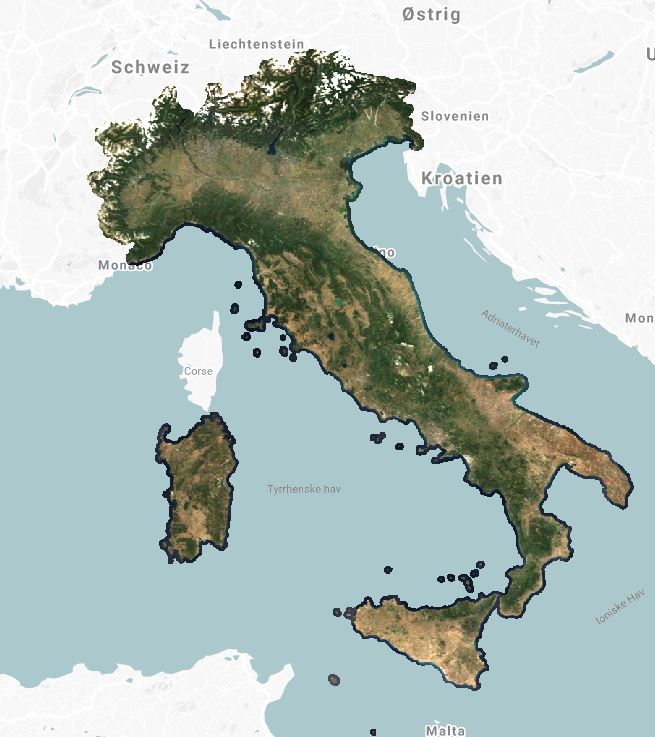
Italy through the clouds
We have compiled a cloud-free composite of Italy, based on thousands of individual Sentinel 2 images from 2018, which can be accessed through our SATLAS site.
Image artefacts, such as orbit path and tile seamlines, cloud and cloud shadow interferences have been removed by our processing, creating a truly analysis-ready data layer, available at full Sentinel 2 resolution.
Use it for land cover classifications or for simple visualizations.
We have also previously produced monthly Sentinel 2 composites for crop type classification in Denmark and made seasonal composites for mangrove mapping in Myanmar.