EO Clinic: Snow and Ice Mapping in Kazakhstan

Why is it important?

The snowpack and its spatial and temporal variability play an important role in the hydrological cycle and water resource management of Kazakhstan, since most rivers and streams are fed by snow melt, which is the main water source for the vegetation growing season. Snow stores a significant mass of water and knowledge about the extent and amount of water provides important input for hydrodynamic models and the management of natural hazards, such as flood events. River ice controls the winter flow regime of rivers and compromises the operation of hydrometric stations, governs the water intake and discharge activities of municipalities and businesses. Particularly during spring, break-up ice can create jams and floods that endanger infrastructure such as bridges. EO based information could feed into a near real time monitoring system to support informed decision making.

Project highlights:

Possibility for near real-time monitoring systems for ice jam detection.

Improved forecasting of snowmelt runoff to inform flood warning tools.

Input for hydrodynamic models for informed decision making.

In more detail..

The Committee on Water Resources of the Ministry of Ecology, Geology and Natural Resources and the Committee for Emergency Situations of the Ministry of Internal Affairs has appointed the Kazakh space agency (Kazakhstan Gharysh Sapary - KGS) to provide solutions to mitigate flood-related hazards and risks. The application of Earth Observation (EO) data is a very efficient and cost-effective way to support flood protection programs. EO’s strength lies in its large-area and high-temporal monitoring capabilities of the Earth’s surface - information of direct relevance to better understand the water dynamics, flood occurrence and finally inform hydrodynamic models to improve flood simulations.

Despite its importance, snow cover, one of the Essential Climate Variables, is often underrepresented in such models. Snow stores a significant mass of water and, with its high dynamic, has a strong effect on regional and global energy and water cycles. Information of ice dynamics can inform tools to monitor risk-prone areas in near real time such as ice jams along rivers that potentially endanger infrastructure or provoke flooding.

In this project, DHI GRAS provided the following five products to KGS:

1. Snow Cover Extent The snowpack and its spatial and temporal variability play an important role in the hydrological cycle and water resource management of Kazakhstan, since most rivers and streams are fed by snow melt, which is the main water source for the vegetation growing season.

2. Snow Water Equivalent SWE represents the amount of water that is contained in a snowpack, i.e., the weight of the meltwater per square meter that would result if the snowpack was melted entirely. Information about SWE is needed in applications such as flood forecasting and irrigation planning.

3. Wet Snow Maps Maps of wet snow can be used as indicator for onset of snow melt and inform hydrodynamic models.
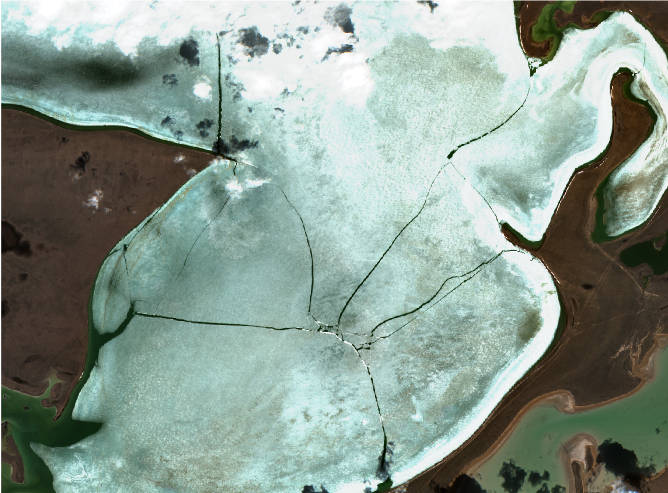
4. Ice break-up Ice break-up is an important hydrologic event with detriments, such as infrastructure damage and lost economic activity. Ice break-up is defined as a process with specific dates identifying key events between the onset of melt and the complete disappearance of ice.

5. Ice jam detection River ice controls the winter flow regime of rivers and compromises the operation of hydrometric stations, governs the water intake and discharge activities of municipalities and businesses. Particularly during spring break-up, ice can create jams and floods that endanger infrastructure such as bridges with large economic losses.

EO Clinic

This project was carried out in the framework of the EO Clinic, in partnership between ESA (European Space Agency), the Asian Development Bank (ADB).

The activity is carried out within the scope of the recent ADB Knowledge and support Technical Assistance (KSTA) focusing on streamlining the use of high-level technologies in Kazakhstan and aligned with the operational priorities for ADB country partnerships and the National Sustainable Development Strategy of Kazakhstan.

Earth Observation Centre of Excellence part of the DHI GROUP

info@dhigroup.com
+45 4516 9200

Agern Alle 5,
2970 Hørsholm,
Denmark

CVR: 36466871

Public geodata and earth observation – new opportunities to support the Green transition

Public geodata and earth observation - new opportunities to support the Green transition

In early 2021, DHI GRAS participated in a hackathon organized by the Danish Business Authority, the Agency for Data Supply and Efficiency and the Danish Agency for Digitisation. The aim of the hackathon was to innovate and design new ways to make best use of publicly available geodata to support the Green transition.

Our dedicated team of data-hackers and developers worked intensively over two weeks to experiment and innovate with public geodata, such as aerial photos, LIDAR data, topographic vector data, environmental data, Sentinel satellite data and lots of other data sources.

In just two weeks we went from initial idea, through experimentation, innovation, and design of a new solution to count and quantify every green square-meter of Denmark (or whichever country with Green ambitions). In a few days we managed to produce a fully updated national forest map (extent and type) in high spatial resolution (10 meters) and developed and applied our Deep Learning models to automatically count and map small landscape elements such as single trees, hedges, and shrubs at centimeter scale – all key ingredients for data-driven decision making within biodiversity and forest management. Full steam ahead and looking forward to continuing our mission of using earth observations and innovative thinking to support the green transition.

Thanks to the organizers and not least our great team working on this! Stay tuned for more updates on how we use geodata to map and monitor the green state of Denmark.

The solution developed through the hackathon can be explored at https://greendenmark.dhigroup.com/ or by clicking the image below.

VHR satellite imagery made easy!

Don't get lost in space

How to order and how to get more information about satellite imagery?

SATELLITE IMAGERY MADE EASY!

What you need to know!

Satellites provide us with a unique overview of our planet. About 5000 satellites are orbiting above us and about 700 of these specifically record earth observation data. As satellites continuously orbit the earth, they enable us to track physical trends, changes, and developments over long periods of time – and in great details. Satellites enable us to derive digital twins or our planet, and document all the change and dynamics on the surface – and this can be used for a wide range of applications.

We use the term spatial resolution to describe the level of detail seen in the images. Generally speaking, a higher spatial resolution enables us to see finer details on the surface. Very High Resolution (VHR) satellite images have a spatial resolution below 2 meters, and the best VHR sensors capture our planet in a 30 centimeter spatial resolution.

Temporal resolution is used to describe how often we are able to acquire a new image from the satellite over the same area. Some satellites will capture images of specific locations each day, some once a week – and some can be tasked specifically to take an image over a given area on a specific time on a specific day. The footprint of a satellite indicates the area of the earth covered by a single image. For some satellites, the footprint is several hundreds of square kilometers, and for some it is only a few square kilometers.

VeniceSentinel2
Venice, Italy, July 2018: Copernicus Sentinel 2 image (10 m resolution)
VenicePleides
Venice, Italy, July 2018: Pléiades image (50 cm resolution) ©Airbus
Artist's rendition of the WorldView-3 spacecraft in orbit (image credit: Maxar/DigitalGlobe)

What can we see and detect with VHR imagery?

The image below is taken from Maxar/DigitalGlobe’s Worldview-3, a very high resolution satellite. The spatial resolution is 30 cm, meaning each pixel in the image corresponds to a real world area of 30 cm x 30 cm.

These type of images can be used to identify archaeological markings or make use of the multi spectral bands in combination with artificial intelligence and machine learning to identify the species of trees and provide information about their overall health or estimate the potential yield of an entire orchard. High resolution images are available from commercial providers such as Maxar/DigitalGlobe, Airbus and Planet.

We can see:

    • Building and rooftop features
    • Solar panels and windows
    • Gardens and backyards
    • Sailing boats
    • Small landscape features
    • Individual trees
    • Cars and roads
    • Larger animals

We can not see:

    • The brand of solar panels
    • License plates
    • Car model
    • Individual people


São Paulo, Brazil, September 2014. WorldView-3 satellite (30 cm resolution) ©Maxar/DigitalGlobe

Highlights of VHR data

Satellite images are cheaper than you think

Satellites were once restricted to intelligence agencies and selected researchers.

Today, the developments within the space industry are driving the prices down, enabling the use of satellite images for almost everybody.

Available globally, at all times and at all scales

All places around the globe are equally accessible. Whether you need images of a suburb in Sydney or a forest in Siberia, these can be easily acquired by an imaging satellite.

The wide variety of satellites means you  can get the perfect images for your location, time frame and budget.

Easy to get, easy to use

Most providers will let you choose the areas and dates that you need online.

The images come in well-known formats such as GeoTiff or NetCDF, and can be loaded into your favourite GIS program.

Frequently Asked Questions (FAQ) about VHR imagery?

 
    • Is VHR satellite imagery expensive?
      Compared to traditional field surveys and aerial imagery, VHR satellite imagery offers a competitively priced alternative. This is particularly true when larger areas are required to be monitored, where the capacity of satellites to capture hundreds of kilometers in a single image provide significant cost savings.

      We offer archived 50 cm imagery from 10 €/km2 and new data acquisitions from 17 €/km2

    • Is VHR imagery available anywhere in the world?
      Yes, imagery can be provided for any location on earth.

    • I need imagery over an area at a specific date and time, is that possible?
      Yes, satellites acquire images across the planet in regular intervals (some daily, some weekly, …) however they can also be tasked to acquire imagery over a specific AOI at a specific date and time in the future.

    • Is cloud free conditions required for the satellites to acquire useable imagery?
      For optical imagery, cloud free conditions are required, however we also provide radar based alternatives (VHR SAR data) which is able to penetrate clouds and provide data regardless of weather conditions. 
 
    • Can I get access to free sample data?
      Yes, we can provide free sample data for you to explore  and test the data yourself. Fill in the form below and specify your request and we will get back to you as soon as possible.

    • How do I order imagery?
      Fill in the form below and specify your area of interest and data needs and we will get back to you as soon as possible with a quote and our advice on preferred data sources that best fits your needs and requirements.

    • Can you provide me with advise on what data to use?
      Our vast experience allows us to offer our customers independent and firm advice on which satellite images that would best fit the specific application area.


      Through our distribution agreements with almost all commercial satellite operators we make sure the latest news and details are available to our customers. 

Recording from QA webinar on VHR satellite data - 11 February, 2021

Want to know more about VHR satellite data? Need a quote for imagery? Want to see what’s available for your area?
Fill out this form and we’ll get back to you as soon as possible.


    How satellites are transforming our daily lives – 50 use case stories released in new catalogue

    How satellites are transforming our daily lives – 50 use case stories released in new catalogue

    A significantly increasing number of satellites, a growing variety of Earth Observation (EO) sensors, improved data quality and the adoption of new data analytics technology has contributed to position satellite data as a primary workhorse and driver of many different critical applications.

    The contribution of Earth Observation data is modernizing public authorities, enabling them to deliver services more effectively and efficiently and it underpins many different functions and solutions within the private sector, across many different domains.

    To showcase the continuously growing usage and application of satellite data (emphasizing Copernicus Sentinel data) in Denmark and internationally, 50 different user stories has been collected in this new use case catalogue entitled ‘DANISH USES OF COPERNICUS – 50 USER STORIES BASED ON EARTH OBSERVATION’.

    As the largest downstream EO service provider in Denmark, we are proud and happy to have contributed to 15 of the 50 use case stories included in the catalogue. It illustrates the diversity of our solutions and our capacity as frontier innovators of novel EO data technology – and we are pleased to share our stories and experience in this catalogue.

    Click the links below to read our use case stories or download the catalogue to explore all 50 use cases:

    Join us February 11, 2021 for our very first VHR ‘Ask the experts’ seminar

    Join us on February 11, 2021 for our very first VHR 'Ask the experts' webinar

    07 JANUARY 2021


    VHR QA seminar
    February 11, 2021 from 10:00 - 10:45 CET

    Last year we hosted a live Q/A session for Danish stakeholders, and this year, due to popular demand, we will follow up with this, our very first, live Q/A session targeting a global audience.

    In this webinar you will get an opportunity to get answers to all your unanswered questions about Very High Resolution (VHR) satellite data. What satellites are out there in space? What can they do? When do they pass by above us? What does the data cost? – this, and much more, you will get answers to in this QA session.

    So much is going on in space these years, so before we open the floor for all your questions, you will be equipped with the latest information about data types, development and application opportunities when our expert, Rasmus Borgstrøm, presents the ‘Latest news from Space’ for the first 10 minutes. Did you know, for example:

    • That today it is possible to record videos from space?
    • That modern satellite sensors can take high resolution images day and night and through cloud cover?
    • That microsatellite constellations will make it possible to acquire new imagery from the same area of interest every hour?

    All this you will learn much more about, but if you can’t wait, you can already learn more about satellites and application potential on http://satellites.dk/.

    After the introduction you will get the opportunity to ask ALL your questions when our two passionate satellite data experts, Rasmus Borgstrøm and Mikkel Lydholm Rasmussen, will be ready to answer your questions for half an hour.

    Why should I participate?

    • Generally, because you are interested in modern satellite technology and satellite data and would like to know more.
    • Because Covid-19 related travel bans and restrictions have prevented you from overseeing your projects at home and abroad and you want to know more about how satellite data can be used as a cost-effective alternative to onsite activities.
    • Because you work on a research project and need to be equipped with the latest knowledge about available satellite data types, level of details and cost aspects over your project site.
    • Because you want to know more about how VHR data can be used as a cost-effective means to monitor and oversight building projects and construction work

    The Q/A session will take place on February 11, 2021, from 10:00 – 10:45 CET. Sign up today to secure your spot at the webinar by following the registration link below.

    We are looking forward to your participation!

    The power of AI! – Turning satellite data into unique knowledge about our planet

    The power of AI! - Turning satellite data into unique knowledge about our planet

    06 JANUARY 2021

    Earth observation infrastructure is developing rapidly these years, with increasingly more satellites being send into space, some of these in large swarms of entire microsatellite constellations. Consequently, satellite remote sensing is not limited by a lack of data, but rather our capacity to make best use of all the data we have available already. The key is to build autonomous and intelligent systems on top of satellite imagery data streams, with a view to detect, analyse and process images faster and more accurately than ever before.

    Imagine the powerful combination of a living digital library that documents every inch of our planet on a daily basis, and the tools and platforms allowing us to extract meaningful insight from this library at scale. We increasingly apply deep learning-based approaches to serve this purpose, allowing us to build effective and scalable solutions that serves unique insight about the change and dynamics on our planet. We use deep learning to underpin the information needs and requirements within many different sectors, including:

    • Maritime industry for detection of reefs, hazardous objects, submerged aquatic vegetation, ships and illegal vessels, icebergs and dynamics in ports and harbours.
    • Construction industry and urban spatial planning for detection of roads, impervious surfaces, roof top types, cars, parking spaces, solar energy potential and general activity within construction zones.
    • Wind energy for monitoring metocean conditions around offshore wind energy sites, mapping wind breaks in open landscapes and estimating surface roughness conditions (including forest height and density)
    For more information about the power of deep learning and how we apply it in DHI GRAS, explore the links below

    DHI GRAS looking for a new Space data engineer

    DHI GRAS looking for a new Space Data Engineer

    04 JANUARY 2021


    Application Deadline:
    31 January 2021

    Expected start date::
    ASAP

    Country:
    Denmark

    City:
    Hørsholm

    Job type:
    Software development and IT

    Working hours:
    Full-time

    Contact person:
    Jonas Blüthgen Sølvsteen
    josl@dhigroup.com

    Are you passionate about developing software to make data flow efficiently and reliably using newest technologies? Do you want to join us turning terabytes of satellite imagery into information through advanced and performance-optimized algorithms - daily?

    At DHI GRAS, we connect Earth observations from space with people. We know satellites and how to refine and combine their data to bring out insights about environment, water, renewable energy, urban development and many more areas of our physical environment to the public and clients all over the world.

    We are a young and international bunch of remote sensing experts, data scientists, software developers and project leaders, many with science background and all with curiosity to learn and make use of the ever-growing capabilities of satellites and newest technologies. We have 20 years of experience in our field and have been expanding rapidly in recent years.

    With around 25 employees, DHI GRAS is at the same time a small and agile company and a global enterprise: We are the space-specialist daughter company of the larger and renowned engineering company DHI, that has offices all around the world. We are located at the group’s headquarters in Hørsholm and work closely together with our colleagues in Denmark and abroad to share knowledge, experience, and supporting functions.

    See our projects to get a sense of what we do: www.dhi-gras.com/projects.

    Responsibilities and challenges
    The main responsibilities and challenges in the job are:

    • Join a small and dedicated team of five (and counting) frontend and backend developers
    • Develop and deploy data flow automation software to the cloud, while growing your knowledge and our capabilities
    • Collaborate closely with our remote sensing analysts to put their algorithms on compute-steroids
    • Design, deploy, and monitor data streams and APIs turning imagery into insight
    • Write clean and reusable code and strive for best practice and dev-friendliness
    • Build on and contribute to open source software and social codings
    • Take responsibility for our tech stack and a decisive role in shaping it
    • Keep progressing and learning through knowledge exchange and sparring across the global company
    Qualifications and personal skills
    • Experienced or bright early-career
    • Experienced in working with performant data processing
    • Proficient in software development in Python (including Git/GitHub)
    • Tech-affine with a sense for strengths and weaknesses of software and systems
    • Unix-savvy, maybe used to Docker, too
    • Not averse to some ETL work and creative to automate it away
    • Used to relational databases like Postgres
    • Acquainted with deploying services in clouds like Azure, AWS, or GCP
    • Curious, self-driven, and a fast learner
    • Good at communicating and proficient in English
    Advantageous skills
    • Experience with geospatial data, in particular raster data (maybe you know of GeoTIFF)
    • Understanding of data flow automation and orchestration software like Airflow, Prefect, Dask, Luigi, Celery
    • Acquaintance with Kubernetes and solid experience with Docker
    • Experience with distributed compute like Spark or Hadoop
    • Experience with CI/CD
    • Understanding of infrastructure and orchestration, e.g. with Terraform, Ansible, Puppet, Chef
    • Flair for light-weight deployment, dev-friendliness, low-maintenance
    We offer
    • A versatile and challenging job with focus on developing and expanding your skills and growing together
    • A social and fun international working environment with innovative and dedicated colleagues, on Slack and in person
    • Experience to learn from in cloud-scale data processing, still a very open tech stack
    • Data you can relate to: beautiful maps of our physical environment
    • Work on projects that have an immediate positive impact on environment and people and get great exposure internationally (ESA, public agencies, UN, NGOs, renewable energy industry, agriculture, …)
    • Close interaction with our satellite data experts, developers, and project owners
    • Strong culture for feedback and recognition for your work
    • Nice office space and equipment in DHI’s newly built headquarters in green surroundings in Hørsholm
    • Delicious lunch prepared by our own kitchen, fruit, coffee and tea
    • Fun and varied company events like Friday bars, seasonal parties and outings (once Covid-safety allows)
    • A healthy work environment with room for family and social life
    • Remote work flexibility
    Office location
    Hørsholm, Denmark - 25 km north of Copenhagen.

    Application / next step
    Submit your application including CV by clicking the button below. Please tell us about your skills and about what motivates you to seek this position.

    Deadline for application is 31 January 2021.

    For further information please explore our website www.dhi-gras.com or contact the Head of Software and Technology - Jonas Sølvsteen at josl@dhigroup.com or + 45 4516 9479.

    2020 – The year in review as seen from space

    2020 - The year in review as seen from space

    21 DECEMBER 2020

    As 2020 comes to an end, we reflect on a turbulent year where the world was turned upside down by the covid-19 pandemic, and we take this opportunity to express our deepest sympathy to all those affected. Despite the pandemic, satellites have continued their journey in space - untouched by the travel restrictions and social distancing on the ground - providing critical data and information to underpin key functions in both the public and private sector domains.

    Like previous years, 2020 has seen an explosive growth and surge in the use and application of satellite data, and the covid pandemic has in many ways underlined the value of continuing to look to space for data to supplement or replace traditional data sources. This value of space data has been further emphasized for us this year, when we – as the first Danish company specializing in satellite data - won the ‘Gazelle’ business growth award by Børsen (The Danish equivalent of Financial Times). With this award, we end the year 2020 - where we also celebrated our 20-year anniversary - on an upbeat note.

    Among our main achievements in 2020, we have:

    • launched a product suite ‘WindSight’ , building on the results of Innowind (an Innovation Fund Denmark partnership from 2017-2020 with VESTAS, Vattenfall, EMD and DTU), which includes 5 new high-quality and high-resolution data products to improve, and complement, existing data used in wind models;
    • launched Flood Metrics, a brand-new all-in-one interface for our state-of-the-art flood monitoring products, providing an easy and transparent platform to search, explore and request our operational flood products;
    • developed and delivered the world’s first high resolution mapping of global wetlands, using new automated methods and Sentinel satellite data. The product has since been integrated into the UN Environment Program sdg661.app, as a key component to support the monitoring of the earth's freshwater-related ecosystems;
    • continued operationalization and further development of the first nationwide operational agricultural monitoring service, specifically tailored to the monitoring needs of the EU’s CAP policy. The system was successfully implemented by the Danish Agricultural Agency (LBST) last year and 2020 marked the second year where the system has been used to underpin CAP monitoring in Denmark.
    • continued to explore new avenues of coupled EO and deep learning approaches for systematic and scalable change detection solutions and updating of national, regional and global data sets.
    We thank all our clients, partners and collaborators for another great year in DHI GRAS and we look forward to continue our journey in 2021, where we will continue to push the boundaries of earth observation solutions to satisfy a growing global market.

    DHI GRAS part of a new partnership to promote satellite solutions in the Arctic

    DHI GRAS part of a new partnership to promote satellite solutions in the Arctic

    17 DECEMBER 2020

    Promoting and developing novel satellite-based solutions and services to enhance maritime safety and environmental monitoring in the Arctic is an important part of our DNA, and our 20-year legacy. As part of our continuous and long-term commitment to enhance opportunities in the Arctic, making best use of satellite data, we are proud to be part of the newly established Danish Partnership for space in the Arctic ‘Kongeriget Danmarks Partnerskab for Rum i Arktis’.

    Through this partnership - alongside 25 Danish, Faroese, and Greenlandic partners – we will build on our Arctic expertise by creating new avenues for space-based solutions and services in the Arctic, and bringing these services closer to the core stakeholders. This partnership underpins the long-term perspectives and potential of satellite data use in the Arctic, and it illustrates the reality of space-based solutions being the only option to consistently map and monitor the change and dynamics in the vast expanses of the Artic. With increasing commercial activity, the evident impacts of climate change and high geopolitical interest – this is more important than ever!

    Within, and beyond, the framework of this partnership we are looking forward to continuing our committed journey in the Arctic, and we look forward to the opportunities and challenges ahead.

    WindSight – improving the accuracy of wind resource assessments through EO solutions

    WINDSIGHT - IMPROVING THE ACCURACY OF WIND RESOURCE ASSESSMENTS THROUGH EO SOLUTIONS:

    1 december 2020

    Frictional forces due to land properties (such as terrain height and the physical structure of vegetation (height, density, etc.)) influence the strength and direction of the wind at the surface. Therefore, reliable, and timely data and information on such properties is critical, to accurately assess the availability of wind resources. However, assessments of wind energy resources is a highly complex and time consuming process – ultimately relying on consistent, accurate and timely models and input data. Yet, in many cases, especially in forested sites, surface data on roughness and forest height is inaccessible or simply not available and this may impact the ability of wind modelers to accurately assess wind resources.

    Satellites provides new opportunities for characterizing surface properties and estimating surface roughness

    The launch of many new satellite missions that routinely monitor land surfaces, combined with the latest advances in machine learning technology, has underpinned new ways to accurately and regularly map and monitor surface properties and surface roughness, thus addressing the existing data gap. 

    In this blog we will describe how we at DHI, together with the wind industry, has developed a new portfolio of surface roughness products, based on the latest satellite data and machine learning technology, and tested them for the wind community.  

    The high resolution land cover product is automated to ensure consistent, reliable and timely global delivery
    The forest height product can be delivered globally and replace most needs for LIDAR campaigns

    From explorative research to a mature and robust solution

    In 2020, the 3 year long Innovation Fund Denmark project ‘Innowind’ by VESTAS, Vattenfall, EMD International A/S, the Technical University of Denmark (DTU) and DHI GRAS concluded.

    This project examined the effect of using satellite-based input layers for flow modeling at the meso- and microscale and trialed these data layers at a selection of global sites, where ground truth observations were available and wind turbines are planned or in operation. Forested sites were particularly in focus, as they have the strongest impact on wind flow and represent 75% of new land-based wind energy developments. The chain of models for resource assessment was adapted to utilize novel satellite-based input layers.

    Introducing WindSight

    InnoWind progressed the assessment of wind energy resources by working with the EU/ESA Copernicus satellite data and products within aerodynamic flow models. Copernicus Global and pan-European products, describing vegetation properties such as forest type and density, was used in combination with digital elevation models to derive the surface drag force. This new approach could eliminate indirect and subjective assessments of surface properties and reduce the uncertainty modelled wind resources. Further, it provides a pathway to more accurate, automated and consistent assessments at different sites.

    As a result of three years’ development efforts, a new satellite-based product portfolio entitled ‘WindSight’ was developed, aiming to improve the accuracy of wind resource assessments. 

    The high resolution forest density product can be delivered globally and replace most needs for LIDAR campaigns
    The high resolution land trend product provides a powerful tool to uncover historic trends and dynamics and predict future forest cover change
    The very high resolution elevation products are available globally and provides a cost-efficient alternative to LIDAR based elevation models.

    5 different products in one tailored data package

    DHI WindSight includes 5 different high-quality and high-resolution data products on land cover, key forest characteristics, historical and future changes, topography and surface roughness – tailored for wind sites anywhere in the World.

      1. Land Cover: The land cover product is generated in near real time using best in class satellite imagery to provide up-to-date, reliable and accurate information about land cover types, in grid sizes up to 10 meters
      2. Forest products: Based on current or historical image analysis of high- satellite imagery, the forest products provide detailed insight on current and historical forest height and forest density in grid sizes of 20 meters.
      3. Historical and future changes: Based on time-series analysis of high-resolution satellite imagery, the land change product provides information about past, current and future forest cover and site conditions.
      4. Very high-resolution (VHR) elevation layers: The VHR elevation and topography data layers are provided in grid sizes down to 1 meter, comparable in quality to more expensive LIDAR based elevation models.
      5. Surface roughness: Using state-of-the-art models, surface roughness data is generated through conversion of the forest density, land cover and forest height data products. These advanced roughness length layers are compatible as input for a wide range of softwares and modelling methods including windPRO, WaSP and CDF tools

    How do we get the data out there? - still learning what the modelling community wants

    We have now tested WindSight for almost 20 sites. The feedback we get from the modelling community is that the improved surface data layers from WindSight seem to decrease the cost of wind energy development by increasing the precision of assessment of wind resources and lowering uncertainty in the planning phase.

    We thereby think WindSight will challenge current industry practice by a new approach where surface properties are derived directly from satellite-based map layers. This eliminates indirect and subjective assessment through field visits or interpretations of optical imagery (e.g. Google Earth).

    This is all very good and a big step forward in providing more accurate base layers for wind modeling. But what does the wind modelling community think? We have talked to some companies but certainly not all. In order to get this technology further adopted by the modelling community we still struggle to understand what the global community needs when it comes to wind model input data. Some of the questions we need answers to are:

      • Are LIDAR campaigns always required in forest areas and can WindSight replace LIDAR campaigns?
      • Do wind modelers develop the surface roughness layers or forest height data from the LIDAR data or from other data types?
      • How often do wind modellers need LIDAR data on forest heights and surface roughness?
      • How frequent and fast would wind modelers mostly like to access the data?

    To help us shape a product that best fits your needs and requirements, we hope that you will answer our short survey by clicking the button below. 

    The high resolution surface roughness map has been tested in several sites globally and shows significant improvements in wind flow modelling especially in forested sites
    Author: Torsten Bondo (TBON@dhigroup.com)

    Earth Observation Centre of Excellence part of the DHI GROUP

    info@dhigroup.com
    +45 4516 9200

    Agern Alle 5,
    2970 Hørsholm,
    Denmark

    CVR: 36466871