Fresh views on Greenland – updated satellite imagery successfully delivered

Fresh views on Greenland – updated satellite imagery successfully delivered

25 MARCH 2021

Topographic maps of Greenland are generally not up to date and the positional accuracy is often inadequate in the breathtaking landscapes outside the main settlement areas. This means that decisions related to public administration, environmental regulation and the potential for economic development are often based on data and maps that may be inaccurate, and this can seriously impede decisions based on these data.

This situation is about to change very soon though, as the Danish government (Through the Agency for Data Supply and Efficiency (SDFE)) has asked for help from space.

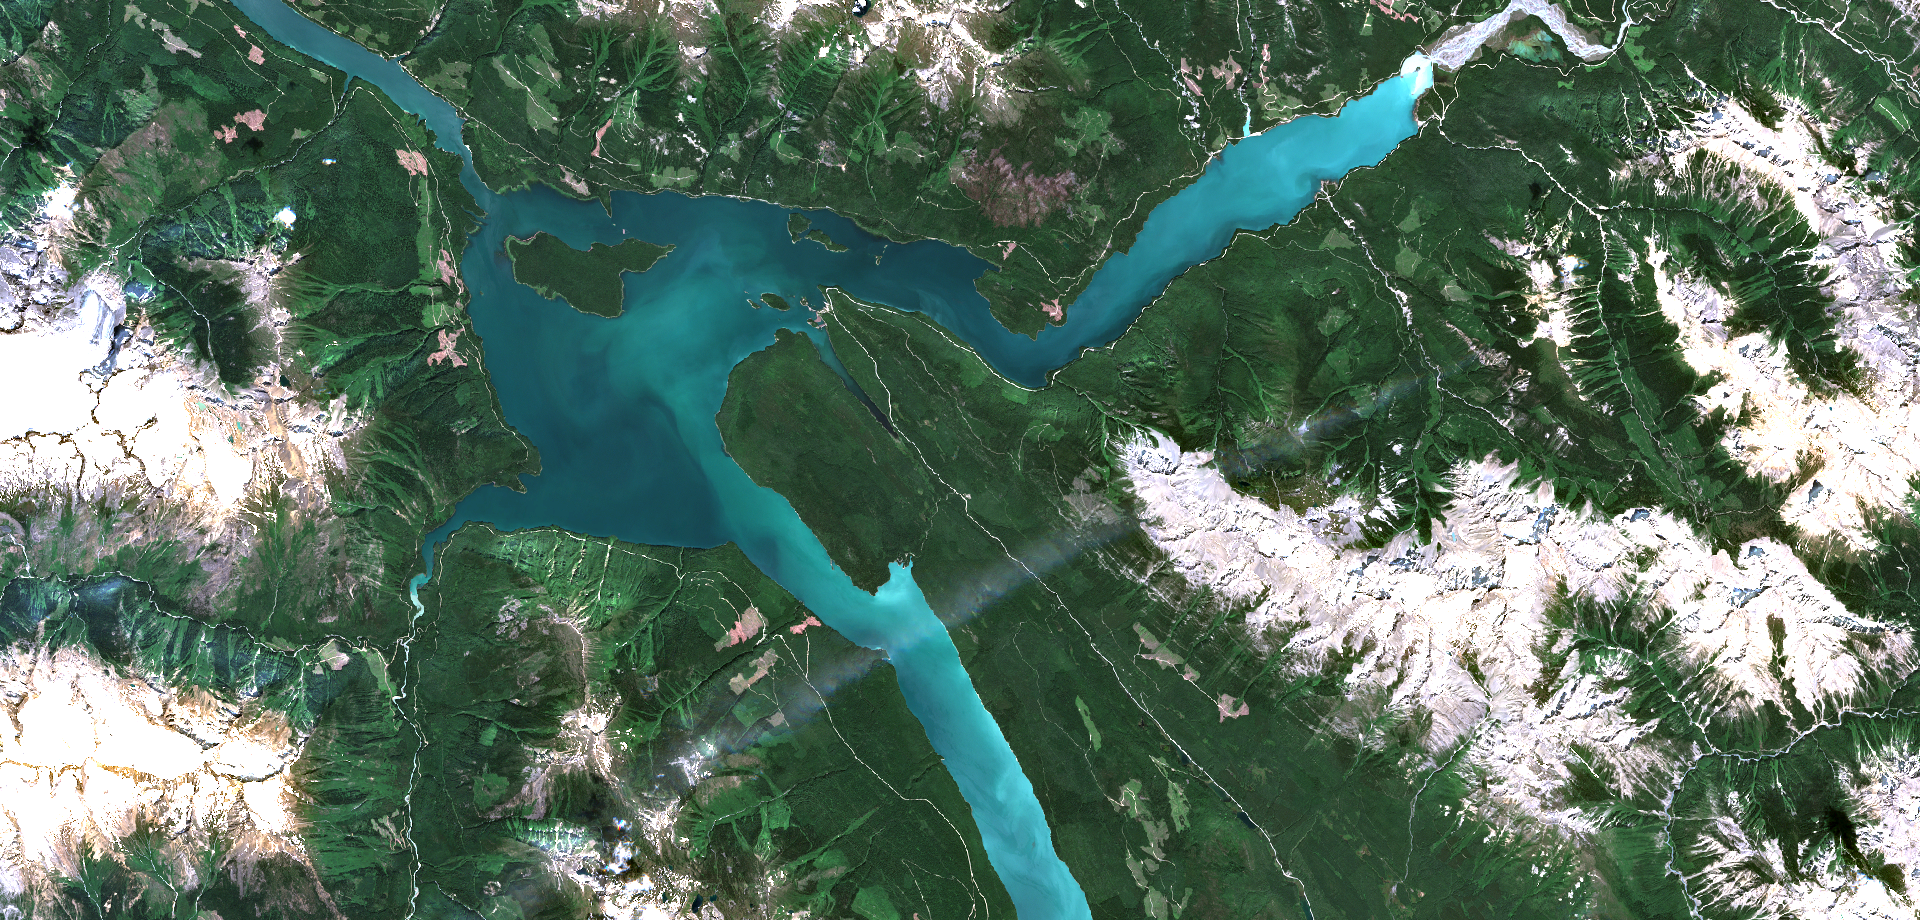
In close collaboration with SDFE and our partners in Airbus Defence and Space , we have processed vast amounts of updated SPOT 6 and 7 satellite imagery covering 225.000 sq.km of Greenland, in a very short time. We have turned these data into cloud free, orthorectified and color optimized image mosaics in 5 different parts of Greenland. The results are fresh views of the astonishing landscape of Greenland.

Stay tuned for updates on getting access to the imagery, which will be freely available very soon

NextLand

Why is it important?

More efficient use of water, and other inputs, in agriculture is gaining importance with recent attention to sustainable resource use. By providing timely, accurate and field-scale information on the crop water use and crop water needs we can help farmers to optimize their practices with both economic and environmental benefits.

Project highlights:

Satellite data can be used to operationally produce potential and actual evapotranspiration maps.

Actionable information, such as crop water deficit, can be used by farmers to improve their irrigation practices.

NextLand store will allow easy access to produced maps through a modern user and machine-to-machine interfaces.

In more detail..

With the Copernicus Earth observation program reaching a mature stage, the time is right to develop operational commercial services based on this high-quality data. This is the aim on the NextLand project, with the focus on agricultural and forestry EO services. At DHI GRAS we have been developing advanced methods to estimate actual and potential evapotranspiration using data from the Copernicus Sentinel satellites and infer crop water needs based on this information. This is the expertise which we are bringing to the NextLand consortium. Through co-creation with selected group of agricultural alpha-users we will fine-tune our evapotranspiration-based products and offer a valuable tool for optimizing irrigation practices with benefits both to the farmers and the environment.

European Commission:

NextLand is funded by the European Union’s H2020 Programme for Research, Technological Development and Demonstration.

H2020 is the biggest EU Research and Innovation programme and a financial instrument aimed at securing Europe’s global competitiveness by driving economic growth and focusing on research as an investment for the future of Europe.

EOatDHI part of the DHI GROUP

gras@dhigroup.com
+45 4516 9100

Agern Alle 5,
2970 Hørsholm,
Denmark

CVR: 36466871

Increasing Crop Water Use Efficiency at Multiple Scales Using Sentinel Evapotranspiration – ET4FAO

Why is it important?

With increasing pressure on fresh water resources, and up to 70% of those resources used in crop irrigation, it is important to monitor and improve crop water use efficiency from field to national scales.

Project highlights:

Evaporanspiration maps covering Lebanon and Tunisia were produced and are available from et4fao.dhigroup.com

Covering a wide range of metocean parameters with expert assessment of quality and only including sufficiently reliable data.

Robust scientific analysis of the new evapotranspiration products and maps available from WaPOR portal is conducted.

In more detail..

The Food and Agriculture Organization (FAO), the custodian agency of SDG indicators 6.4.1 and 6.4.2, is running a portal called Water Productivity Open-access portal (WaPOR) to encourage the use of satellite data in crop water use efficiency monitoring. The WaPOR portal currently relies on Terra and Aqua, PROBA-V and Landsat satellite data, many of which are at the end of their expected lifetime. In this project we perform robust, scientific analysis of the possibility to use Copernicus data (especially observations from the Sentinel-2 and Sentinel-3 satellites) in place of the legacy satellites, to produce national maps of evapotranspiration able to capture field-scale crop water use.

The project builds upon methodologies developed during the ESA-funded Sen-ET project. During that project, a robust method was developed to estimate land-surface energy fluxes, including evapotranspiration, at field-scale using Sentinel-2 and Sentinel-3 data, despite the absence of a high-resolution thermal sensor in the Sentinel constellation. The method consisted of a machine-learning data fusion algorithm for sharpening land surface temperature measured by Sentinel-3 at 1 km to the 20 m spatial resolution of Sentinel-2, followed by a physically based modelling of land-surface energy fluxes. In ET4FAO we apply this technique to produce evapotranspiration maps covering the whole of Lebanon and Tunisia at 20 m, 100 m and 300 m spatial resolutions. Those maps are then compared against products available from the FAO WaPOR portal and validated against independent field measurements.

European Space Agency:

The project in funded by ESA as part of the EO Science for Society Open Call. It is a partnership between scientists from DHI GRAS and COMPLUTIG (Spain) with FAO acting as the main stakeholder.

EOatDHI part of the DHI GROUP

gras@dhigroup.com
+45 4516 9100

Agern Alle 5,
2970 Hørsholm,
Denmark

CVR: 36466871

Marine vegetation mapping in Sweden

Why is it important?

According to the EU Habitat directive and the Marine Strategy Framework Directive, member states are required to map, monitor and evaluate changes in the quality and areal distribution of different marine habitats and biotopes. Submerged aquatic vegetation (SAV), in particular eelgrass, is one of the key indicators of ecological status and environmental state of water bodies, and therefore widely used in reporting related to these directives.

Project highlights:

Copernicus Sentinel-2 imagery, novel machine learning techniques and advanced data processing to create the first spatial overview of the distribution of SAV at national scale in Sweden.

A cloud-based web-application for Sentinel-2 based SAV mapping without prior specialist knowledge Input.

A training dataset constructed with more than 30 000 manually drawn polygons to build a robust machine learning model and predict nationwide SAV.

In more detail..

In 2020 we embarked on a project together with the Swedish regional and national authorities, to combine Copernicus Sentinel-2 satellite imagery, novel machine learning techniques and advanced data processing to create the first spatial overview of the distribution of SAV at national scale in Sweden. A training dataset constructed with more than 30 000 manually labelled polygons was used to build the classification model, with which more than 3800 km2 of the underwater habitats, of the entire shallow coastal zone of Sweden, was mapped. Applying Sentinel-2 imagery from 2019-2020, the resulting classification, in 10-meter spatial resolution, provides nationwide coverage and detailed insight into the status of aquatic vegetation in the shallow water areas of Sweden.

Moreover, in close coordination with the key stakeholders, we have developed a cloud-based web-application that enables individual counties along the Swedish coast to perform their own SAV mapping without prior specialist knowledge. This ties into a long-term objective of the counties in Sweden to easier comply with national monitoring and reporting requirements, and thereby for Sweden to better comply with international requirements at EU level.

The project outcome and methodologies are further described in the following peer-reviewed article:

Huber, Silvia. et al. (2021), Novel approach to large-scale monitoring of submerged aquatic vegetation: A nationwide example from Sweden. Integrated Environmental Assessment and Management.

Länsstyrelsen Västerbotten

Länsstyrelsen Västerbotten, on behalf of the Swedish Agency for Marine and Water Management.

EOatDHI part of the DHI GROUP

gras@dhigroup.com
+45 4516 9100

Agern Alle 5,
2970 Hørsholm,
Denmark

CVR: 36466871

EO Clinic: Snow and Ice Mapping in Kazakhstan

Why is it important?

The snowpack and its spatial and temporal variability play an important role in the hydrological cycle and water resource management of Kazakhstan, since most rivers and streams are fed by snow melt, which is the main water source for the vegetation growing season. Snow stores a significant mass of water and knowledge about the extent and amount of water provides important input for hydrodynamic models and the management of natural hazards, such as flood events. River ice controls the winter flow regime of rivers and compromises the operation of hydrometric stations, governs the water intake and discharge activities of municipalities and businesses. Particularly during spring, break-up ice can create jams and floods that endanger infrastructure such as bridges. EO based information could feed into a near real time monitoring system to support informed decision making.

Project highlights:

Possibility for near real-time monitoring systems for ice jam detection.

Improved forecasting of snowmelt runoff to inform flood warning tools.

Input for hydrodynamic models for informed decision making.

In more detail..

The Committee on Water Resources of the Ministry of Ecology, Geology and Natural Resources and the Committee for Emergency Situations of the Ministry of Internal Affairs has appointed the Kazakh space agency (Kazakhstan Gharysh Sapary - KGS) to provide solutions to mitigate flood-related hazards and risks. The application of Earth Observation (EO) data is a very efficient and cost-effective way to support flood protection programs. EO’s strength lies in its large-area and high-temporal monitoring capabilities of the Earth’s surface - information of direct relevance to better understand the water dynamics, flood occurrence and finally inform hydrodynamic models to improve flood simulations.

Despite its importance, snow cover, one of the Essential Climate Variables, is often underrepresented in such models. Snow stores a significant mass of water and, with its high dynamic, has a strong effect on regional and global energy and water cycles. Information of ice dynamics can inform tools to monitor risk-prone areas in near real time such as ice jams along rivers that potentially endanger infrastructure or provoke flooding.

In this project, DHI GRAS provided the following five products to KGS:

1. Snow Cover Extent The snowpack and its spatial and temporal variability play an important role in the hydrological cycle and water resource management of Kazakhstan, since most rivers and streams are fed by snow melt, which is the main water source for the vegetation growing season.

2. Snow Water Equivalent SWE represents the amount of water that is contained in a snowpack, i.e., the weight of the meltwater per square meter that would result if the snowpack was melted entirely. Information about SWE is needed in applications such as flood forecasting and irrigation planning.

3. Wet Snow Maps Maps of wet snow can be used as indicator for onset of snow melt and inform hydrodynamic models.

4. Ice break-up Ice break-up is an important hydrologic event with detriments, such as infrastructure damage and lost economic activity. Ice break-up is defined as a process with specific dates identifying key events between the onset of melt and the complete disappearance of ice.

5. Ice jam detection River ice controls the winter flow regime of rivers and compromises the operation of hydrometric stations, governs the water intake and discharge activities of municipalities and businesses. Particularly during spring break-up, ice can create jams and floods that endanger infrastructure such as bridges with large economic losses.

EO Clinic

This project was carried out in the framework of the EO Clinic, in partnership between ESA (European Space Agency), the Asian Development Bank (ADB).

The activity is carried out within the scope of the recent ADB Knowledge and support Technical Assistance (KSTA) focusing on streamlining the use of high-level technologies in Kazakhstan and aligned with the operational priorities for ADB country partnerships and the National Sustainable Development Strategy of Kazakhstan.

EOatDHI part of the DHI GROUP

gras@dhigroup.com
+45 4516 9100

Agern Alle 5,
2970 Hørsholm,
Denmark

CVR: 36466871

Public geodata and earth observation – new opportunities to support the Green transition

Public geodata and earth observation - new opportunities to support the Green transition

In early 2021, DHI GRAS participated in a hackathon organized by the Danish Business Authority, the Agency for Data Supply and Efficiency and the Danish Agency for Digitisation. The aim of the hackathon was to innovate and design new ways to make best use of publicly available geodata to support the Green transition.

Our dedicated team of data-hackers and developers worked intensively over two weeks to experiment and innovate with public geodata, such as aerial photos, LIDAR data, topographic vector data, environmental data, Sentinel satellite data and lots of other data sources.

In just two weeks we went from initial idea, through experimentation, innovation, and design of a new solution to count and quantify every green square-meter of Denmark (or whichever country with Green ambitions). In a few days we managed to produce a fully updated national forest map (extent and type) in high spatial resolution (10 meters) and developed and applied our Deep Learning models to automatically count and map small landscape elements such as single trees, hedges, and shrubs at centimeter scale – all key ingredients for data-driven decision making within biodiversity and forest management. Full steam ahead and looking forward to continuing our mission of using earth observations and innovative thinking to support the green transition.

Thanks to the organizers and not least our great team working on this! Stay tuned for more updates on how we use geodata to map and monitor the green state of Denmark.

The solution developed through the hackathon can be explored at https://greendenmark.dhigroup.com/ or by clicking the image below.

VHR satellite imagery made easy!

Don't get lost in space

How to order and how to get more information about satellite imagery?

SATELLITE IMAGERY MADE EASY!

What you need to know!

Satellites provide us with a unique overview of our planet. About 5000 satellites are orbiting above us and about 700 of these specifically record earth observation data. As satellites continuously orbit the earth, they enable us to track physical trends, changes, and developments over long periods of time – and in great details. Satellites enable us to derive digital twins or our planet, and document all the change and dynamics on the surface – and this can be used for a wide range of applications.

We use the term spatial resolution to describe the level of detail seen in the images. Generally speaking, a higher spatial resolution enables us to see finer details on the surface. Very High Resolution (VHR) satellite images have a spatial resolution below 2 meters, and the best VHR sensors capture our planet in a 30 centimeter spatial resolution.

Temporal resolution is used to describe how often we are able to acquire a new image from the satellite over the same area. Some satellites will capture images of specific locations each day, some once a week – and some can be tasked specifically to take an image over a given area on a specific time on a specific day. The footprint of a satellite indicates the area of the earth covered by a single image. For some satellites, the footprint is several hundreds of square kilometers, and for some it is only a few square kilometers.

VeniceSentinel2
Venice, Italy, July 2018: Copernicus Sentinel 2 image (10 m resolution)
VenicePleides
Venice, Italy, July 2018: Pléiades image (50 cm resolution) ©Airbus
Artist's rendition of the WorldView-3 spacecraft in orbit (image credit: Maxar/DigitalGlobe)

What can we see and detect with VHR imagery?

The image below is taken from Maxar/DigitalGlobe’s Worldview-3, a very high resolution satellite. The spatial resolution is 30 cm, meaning each pixel in the image corresponds to a real world area of 30 cm x 30 cm.

These type of images can be used to identify archaeological markings or make use of the multi spectral bands in combination with artificial intelligence and machine learning to identify the species of trees and provide information about their overall health or estimate the potential yield of an entire orchard. High resolution images are available from commercial providers such as Maxar/DigitalGlobe, Airbus and Planet.

We can see:

    • Building and rooftop features
    • Solar panels and windows
    • Gardens and backyards
    • Sailing boats
    • Small landscape features
    • Individual trees
    • Cars and roads
    • Larger animals

We can not see:

    • The brand of solar panels
    • License plates
    • Car model
    • Individual people


São Paulo, Brazil, September 2014. WorldView-3 satellite (30 cm resolution) ©Maxar/DigitalGlobe

Highlights of VHR data

Satellite images are cheaper than you think

Satellites were once restricted to intelligence agencies and selected researchers.

Today, the developments within the space industry are driving the prices down, enabling the use of satellite images for almost everybody.

Available globally, at all times and at all scales

All places around the globe are equally accessible. Whether you need images of a suburb in Sydney or a forest in Siberia, these can be easily acquired by an imaging satellite.

The wide variety of satellites means you  can get the perfect images for your location, time frame and budget.

Easy to get, easy to use

Most providers will let you choose the areas and dates that you need online.

The images come in well-known formats such as GeoTiff or NetCDF, and can be loaded into your favourite GIS program.

Frequently Asked Questions (FAQ) about VHR imagery?

 
    • Is VHR satellite imagery expensive?
      Compared to traditional field surveys and aerial imagery, VHR satellite imagery offers a competitively priced alternative. This is particularly true when larger areas are required to be monitored, where the capacity of satellites to capture hundreds of kilometers in a single image provide significant cost savings.

      We offer archived 50 cm imagery from 10 €/km2 and new data acquisitions from 17 €/km2

    • Is VHR imagery available anywhere in the world?
      Yes, imagery can be provided for any location on earth.

    • I need imagery over an area at a specific date and time, is that possible?
      Yes, satellites acquire images across the planet in regular intervals (some daily, some weekly, …) however they can also be tasked to acquire imagery over a specific AOI at a specific date and time in the future.

    • Is cloud free conditions required for the satellites to acquire useable imagery?
      For optical imagery, cloud free conditions are required, however we also provide radar based alternatives (VHR SAR data) which is able to penetrate clouds and provide data regardless of weather conditions. 
 
    • Can I get access to free sample data?
      Yes, we can provide free sample data for you to explore  and test the data yourself. Fill in the form below and specify your request and we will get back to you as soon as possible.

    • How do I order imagery?
      Fill in the form below and specify your area of interest and data needs and we will get back to you as soon as possible with a quote and our advice on preferred data sources that best fits your needs and requirements.

    • Can you provide me with advise on what data to use?
      Our vast experience allows us to offer our customers independent and firm advice on which satellite images that would best fit the specific application area.


      Through our distribution agreements with almost all commercial satellite operators we make sure the latest news and details are available to our customers. 

Recording from QA webinar on VHR satellite data - 11 February, 2021

Want to know more about VHR satellite data? Need a quote for imagery? Want to see what’s available for your area?
Fill out this form and we’ll get back to you as soon as possible.


    How satellites are transforming our daily lives – 50 use case stories released in new catalogue

    How satellites are transforming our daily lives – 50 use case stories released in new catalogue

    A significantly increasing number of satellites, a growing variety of Earth Observation (EO) sensors, improved data quality and the adoption of new data analytics technology has contributed to position satellite data as a primary workhorse and driver of many different critical applications.

    The contribution of Earth Observation data is modernizing public authorities, enabling them to deliver services more effectively and efficiently and it underpins many different functions and solutions within the private sector, across many different domains.

    To showcase the continuously growing usage and application of satellite data (emphasizing Copernicus Sentinel data) in Denmark and internationally, 50 different user stories has been collected in this new use case catalogue entitled ‘DANISH USES OF COPERNICUS – 50 USER STORIES BASED ON EARTH OBSERVATION’.

    As the largest downstream EO service provider in Denmark, we are proud and happy to have contributed to 15 of the 50 use case stories included in the catalogue. It illustrates the diversity of our solutions and our capacity as frontier innovators of novel EO data technology – and we are pleased to share our stories and experience in this catalogue.

    Click the links below to read our use case stories or download the catalogue to explore all 50 use cases:

    Join us February 11, 2021 for our very first VHR ‘Ask the experts’ seminar

    Join us on February 11, 2021 for our very first VHR 'Ask the experts' webinar

    07 JANUARY 2021


    VHR QA seminar
    February 11, 2021 from 10:00 - 10:45 CET

    Last year we hosted a live Q/A session for Danish stakeholders, and this year, due to popular demand, we will follow up with this, our very first, live Q/A session targeting a global audience.

    In this webinar you will get an opportunity to get answers to all your unanswered questions about Very High Resolution (VHR) satellite data. What satellites are out there in space? What can they do? When do they pass by above us? What does the data cost? – this, and much more, you will get answers to in this QA session.

    So much is going on in space these years, so before we open the floor for all your questions, you will be equipped with the latest information about data types, development and application opportunities when our expert, Rasmus Borgstrøm, presents the ‘Latest news from Space’ for the first 10 minutes. Did you know, for example:

    • That today it is possible to record videos from space?
    • That modern satellite sensors can take high resolution images day and night and through cloud cover?
    • That microsatellite constellations will make it possible to acquire new imagery from the same area of interest every hour?

    All this you will learn much more about, but if you can’t wait, you can already learn more about satellites and application potential on http://satellites.dk/.

    After the introduction you will get the opportunity to ask ALL your questions when our two passionate satellite data experts, Rasmus Borgstrøm and Mikkel Lydholm Rasmussen, will be ready to answer your questions for half an hour.

    Why should I participate?

    • Generally, because you are interested in modern satellite technology and satellite data and would like to know more.
    • Because Covid-19 related travel bans and restrictions have prevented you from overseeing your projects at home and abroad and you want to know more about how satellite data can be used as a cost-effective alternative to onsite activities.
    • Because you work on a research project and need to be equipped with the latest knowledge about available satellite data types, level of details and cost aspects over your project site.
    • Because you want to know more about how VHR data can be used as a cost-effective means to monitor and oversight building projects and construction work

    The Q/A session will take place on February 11, 2021, from 10:00 – 10:45 CET. Sign up today to secure your spot at the webinar by following the registration link below.

    We are looking forward to your participation!

    The power of AI! – Turning satellite data into unique knowledge about our planet

    The power of AI! - Turning satellite data into unique knowledge about our planet

    06 JANUARY 2021

    Earth observation infrastructure is developing rapidly these years, with increasingly more satellites being send into space, some of these in large swarms of entire microsatellite constellations. Consequently, satellite remote sensing is not limited by a lack of data, but rather our capacity to make best use of all the data we have available already. The key is to build autonomous and intelligent systems on top of satellite imagery data streams, with a view to detect, analyse and process images faster and more accurately than ever before.

    Imagine the powerful combination of a living digital library that documents every inch of our planet on a daily basis, and the tools and platforms allowing us to extract meaningful insight from this library at scale. We increasingly apply deep learning-based approaches to serve this purpose, allowing us to build effective and scalable solutions that serves unique insight about the change and dynamics on our planet. We use deep learning to underpin the information needs and requirements within many different sectors, including:

    • Maritime industry for detection of reefs, hazardous objects, submerged aquatic vegetation, ships and illegal vessels, icebergs and dynamics in ports and harbours.
    • Construction industry and urban spatial planning for detection of roads, impervious surfaces, roof top types, cars, parking spaces, solar energy potential and general activity within construction zones.
    • Wind energy for monitoring metocean conditions around offshore wind energy sites, mapping wind breaks in open landscapes and estimating surface roughness conditions (including forest height and density)
    For more information about the power of deep learning and how we apply it in DHI GRAS, explore the links below