VeriCAP

Why is it important?

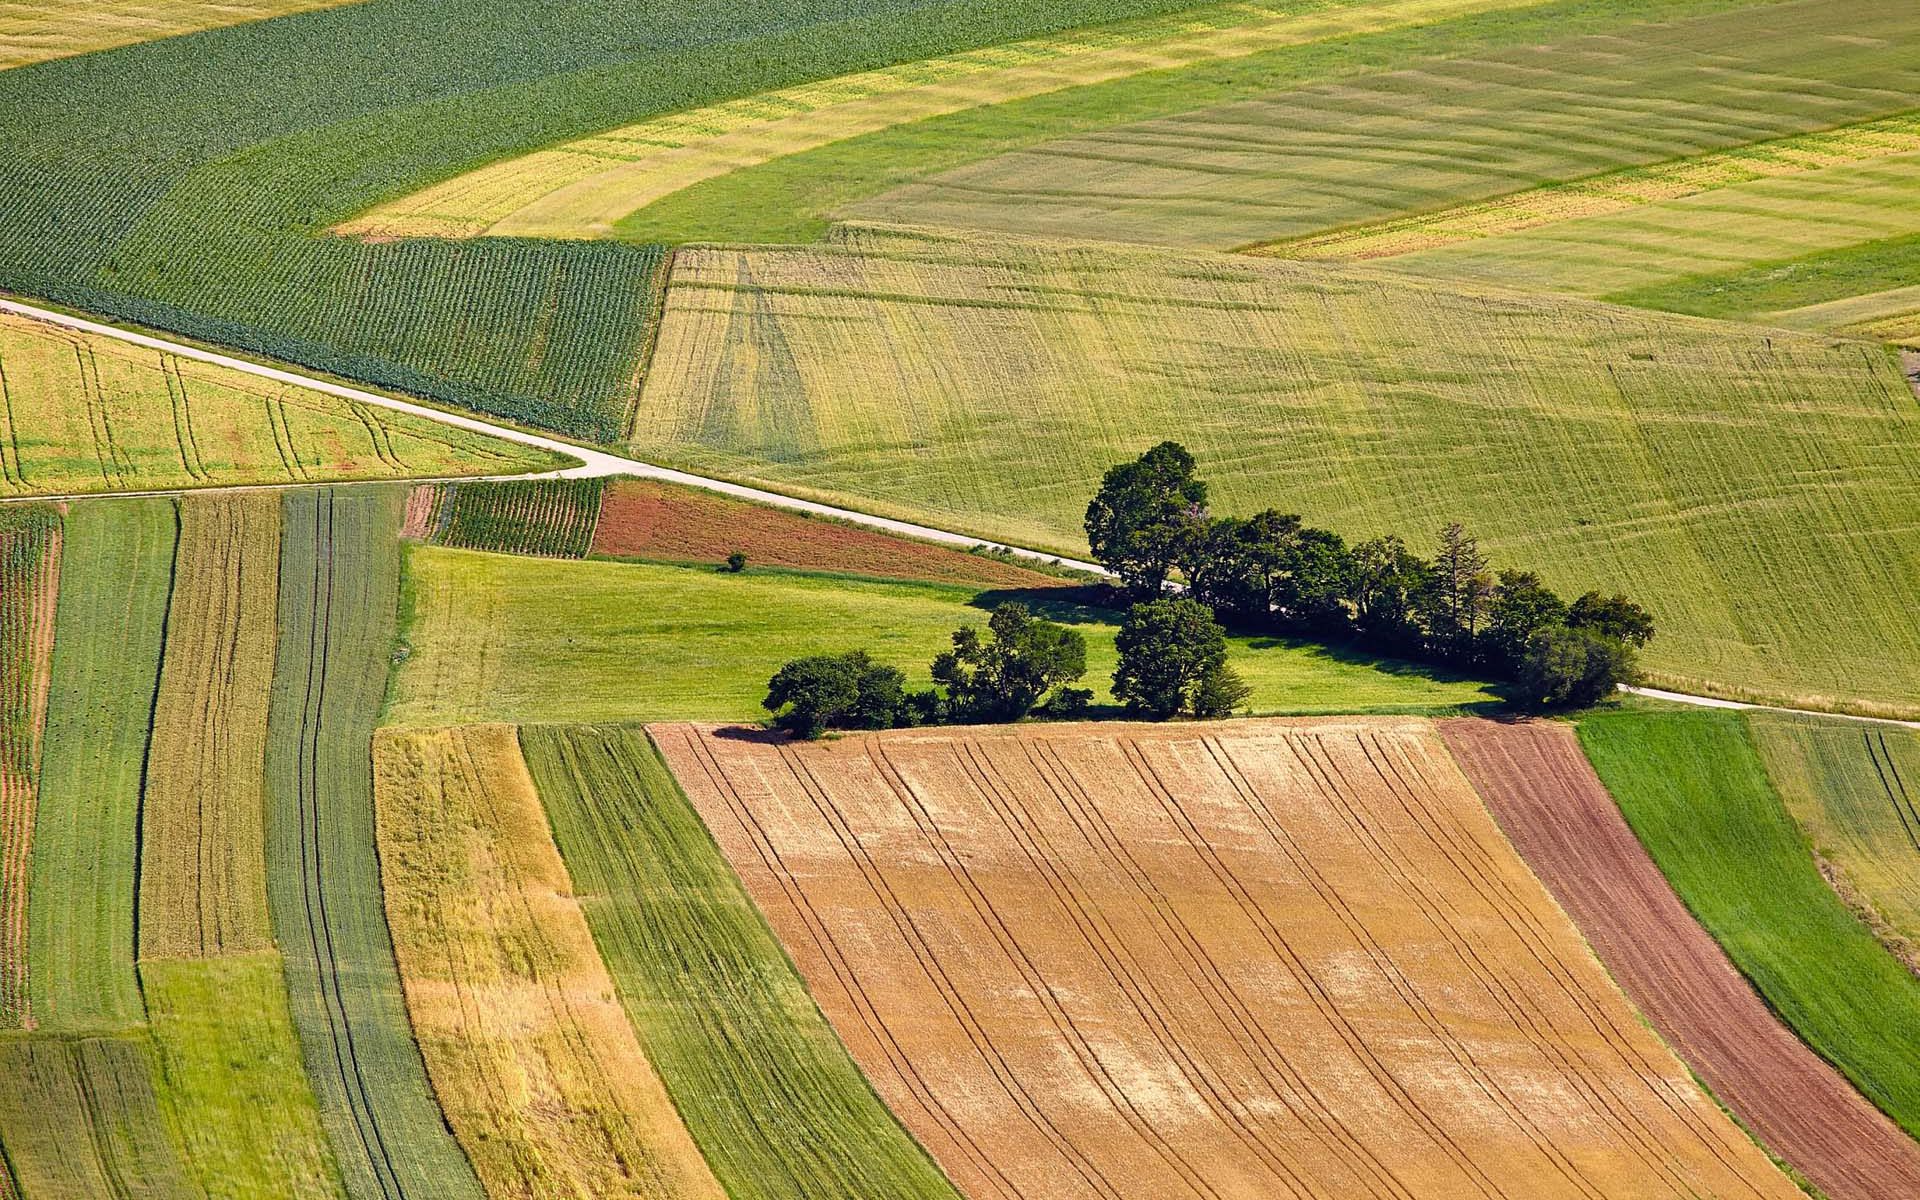
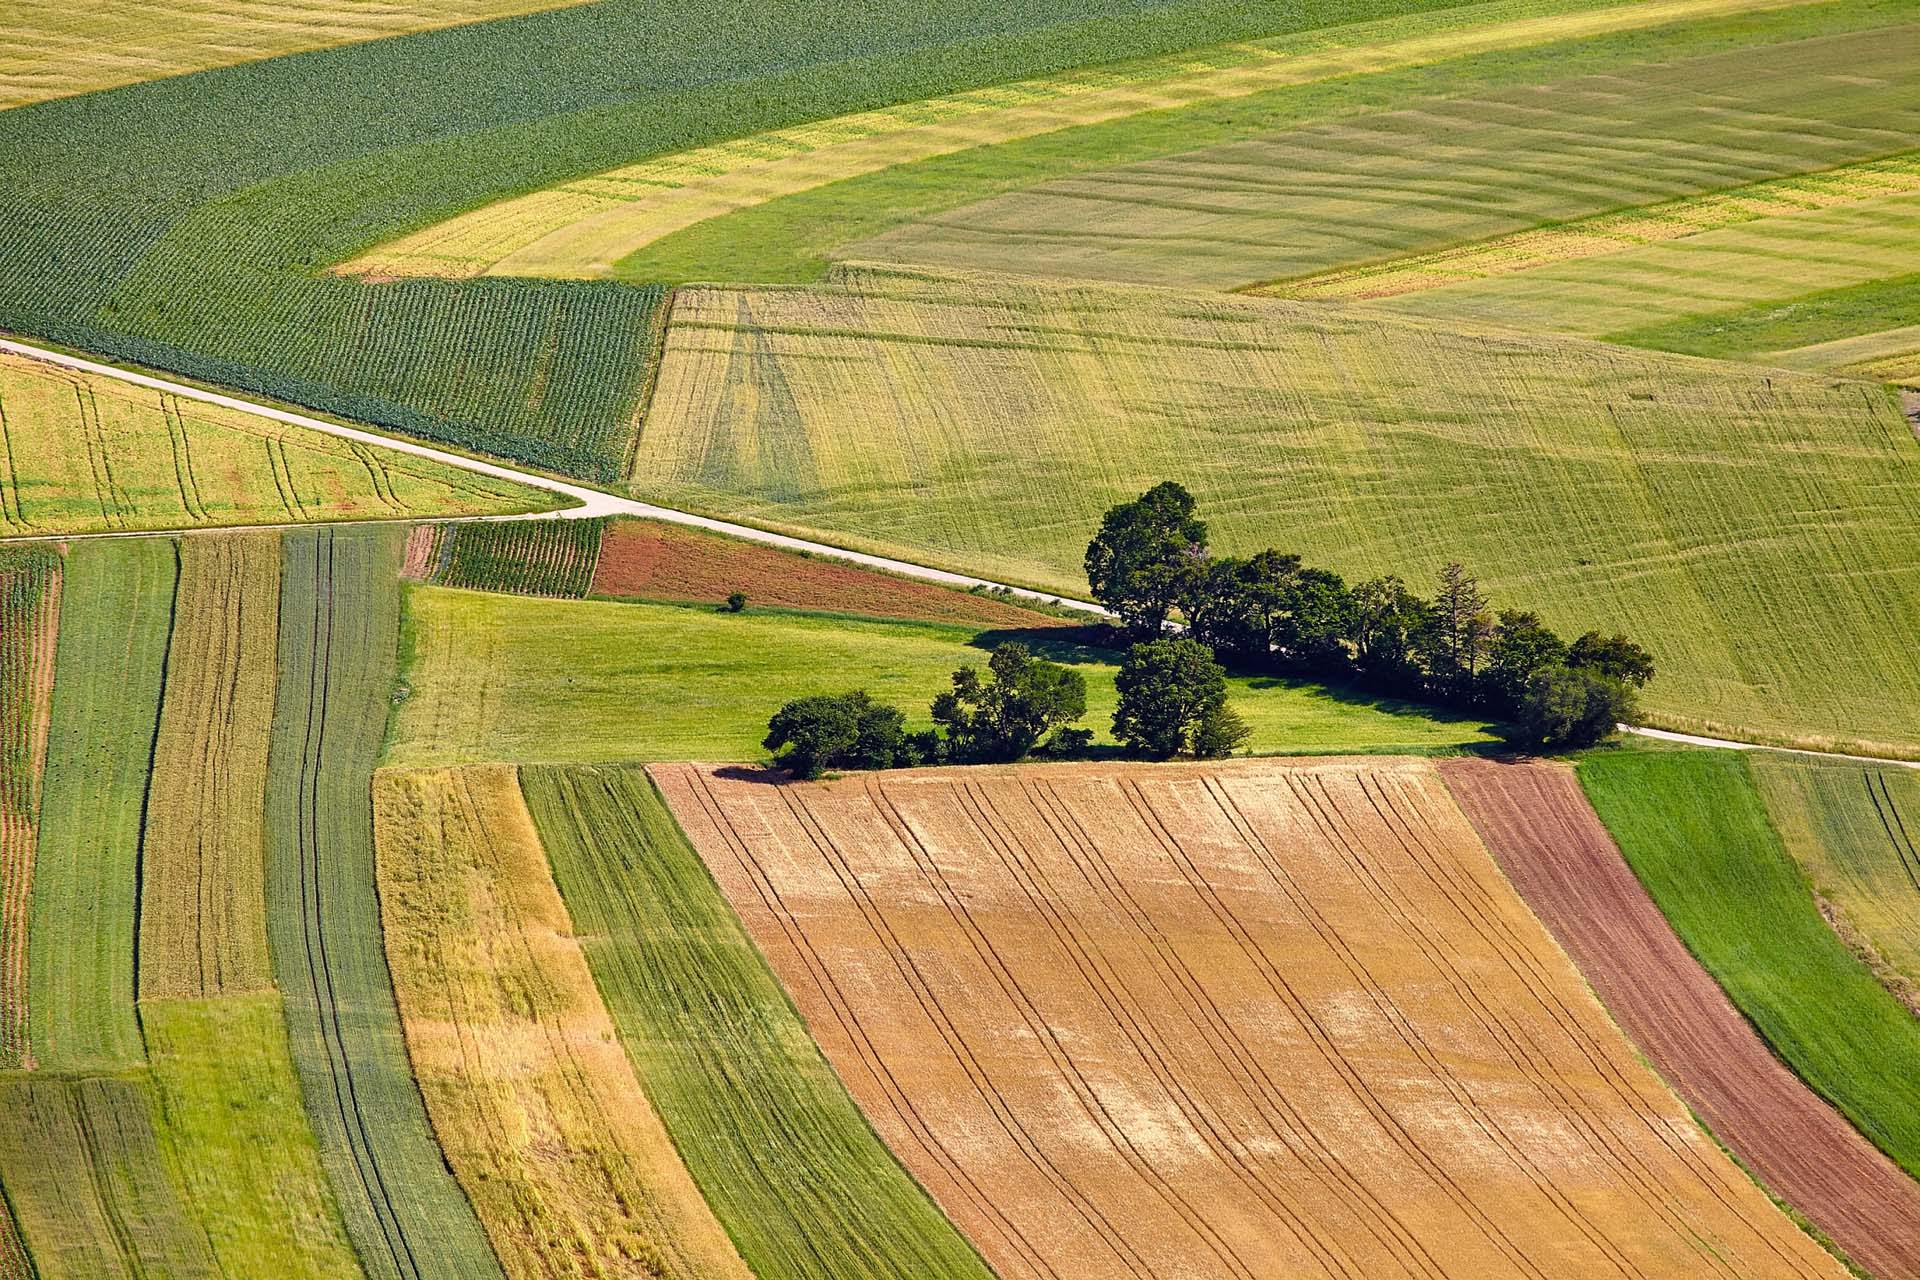
Every year, paying agencies across the EU performs thousands of on-site control visits to field parcels across nations, to check if farmers report correctly on crop types and farm management practices according to the rules, procedures and eligibility requirements under the framework of EU’s Common Agricultural Policy (CAP). A single control visit is often not sufficient to cover the different agricultural activities over the year, thus increasing demands of time and resources for both paying agencies and applicants.

How can it help?

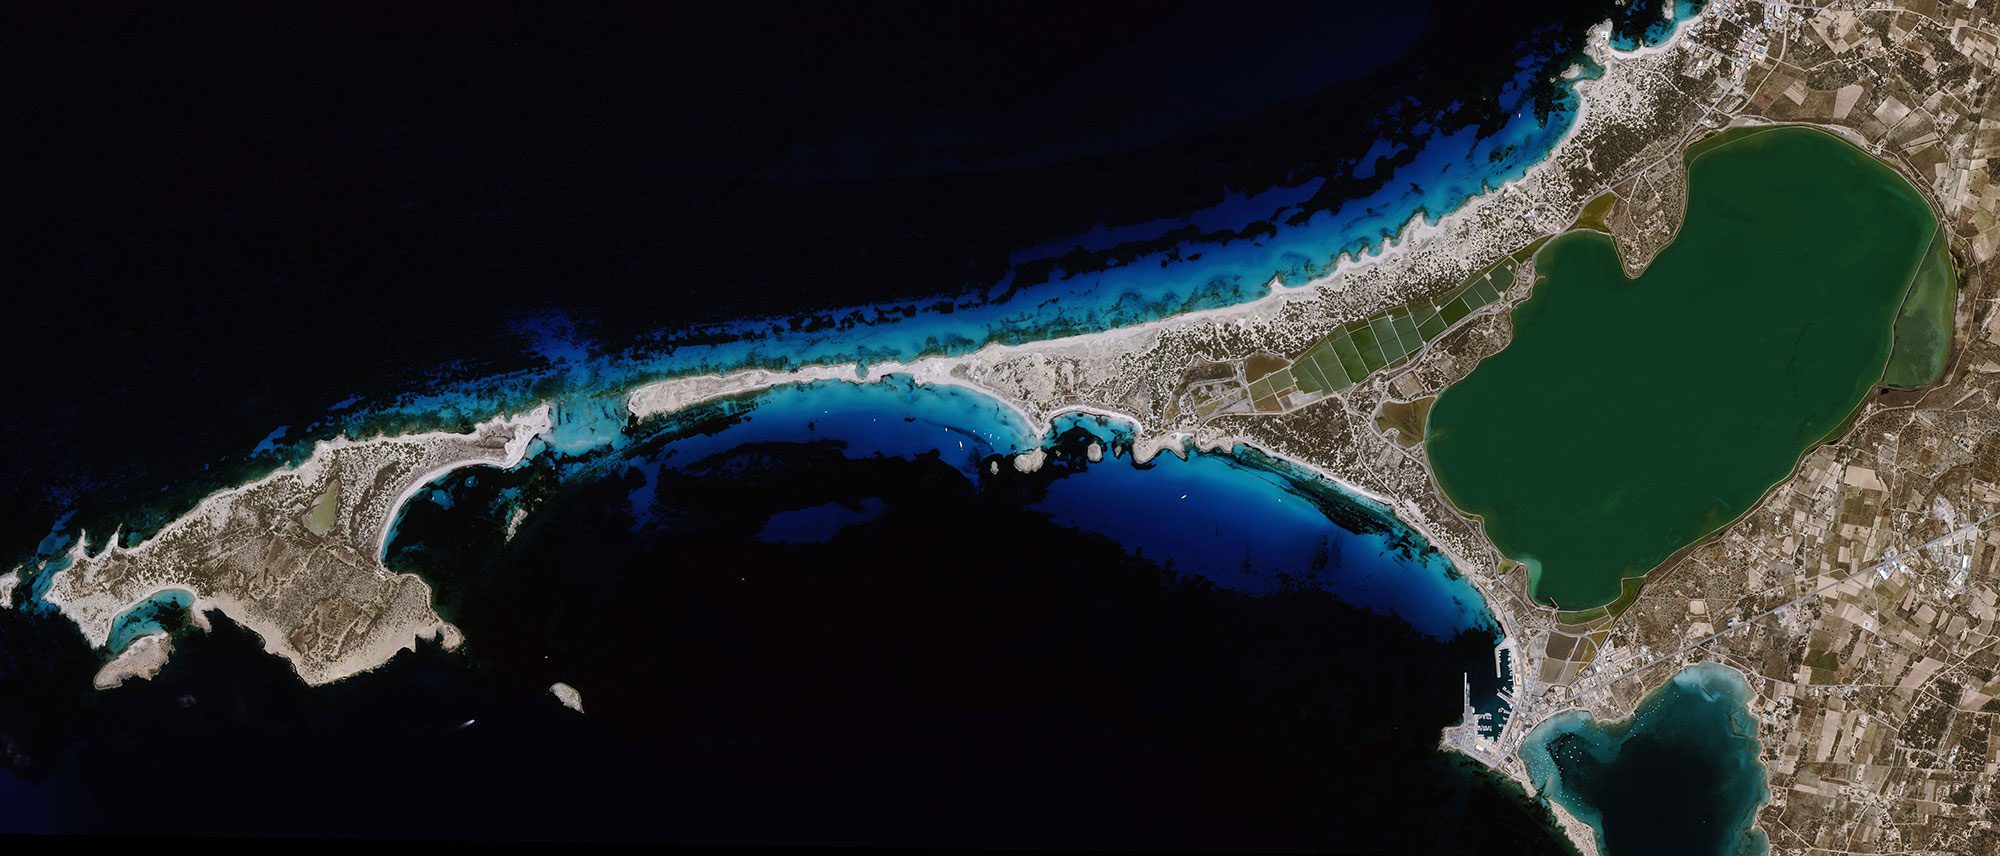
In line with the requirements of the 2020 CAP reform, aiming to modernize and simplify CAP requirements, satellite-based CAP monitoring solutions are increasingly being adopted to address the existing monitoring burden, as a cost efficient and effective solution to monitor crops and activities on field parcels at national level.

VeriCAP provides a streamlined and accurate check by monitoring (CbM) solution to monitor crop types and farm management practices according to CAP rules and requirements. VeriCAP has been developed, tested and operationally implemented at national level by the Danish Agricultural Agency (DAA), as an end-to-end CAP monitoring solution, enabling them to harmonise existing monitoring frameworks, reduce the need for field visits and ultimately, increase effectiveness and reduce costs.

VeriCAP provides an integrated, scaleable and flexible solution that serves the specific priorities and local conditions of each EU member state or regional authority.

What you get!

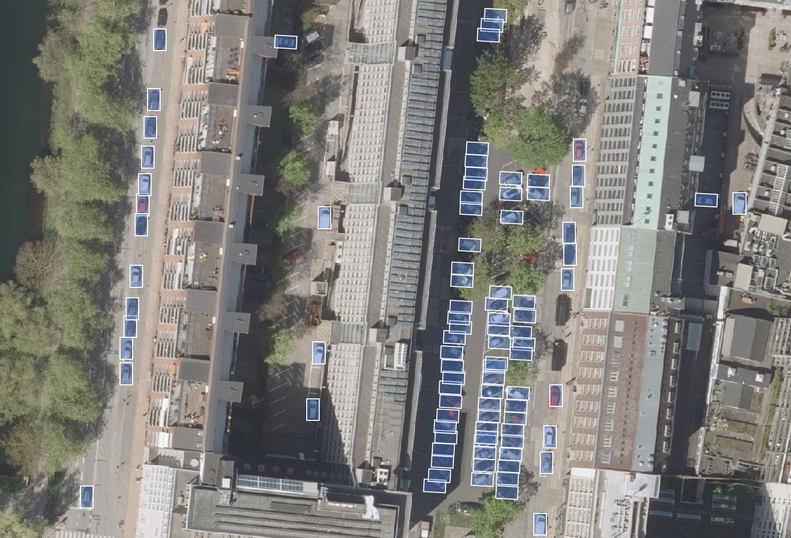
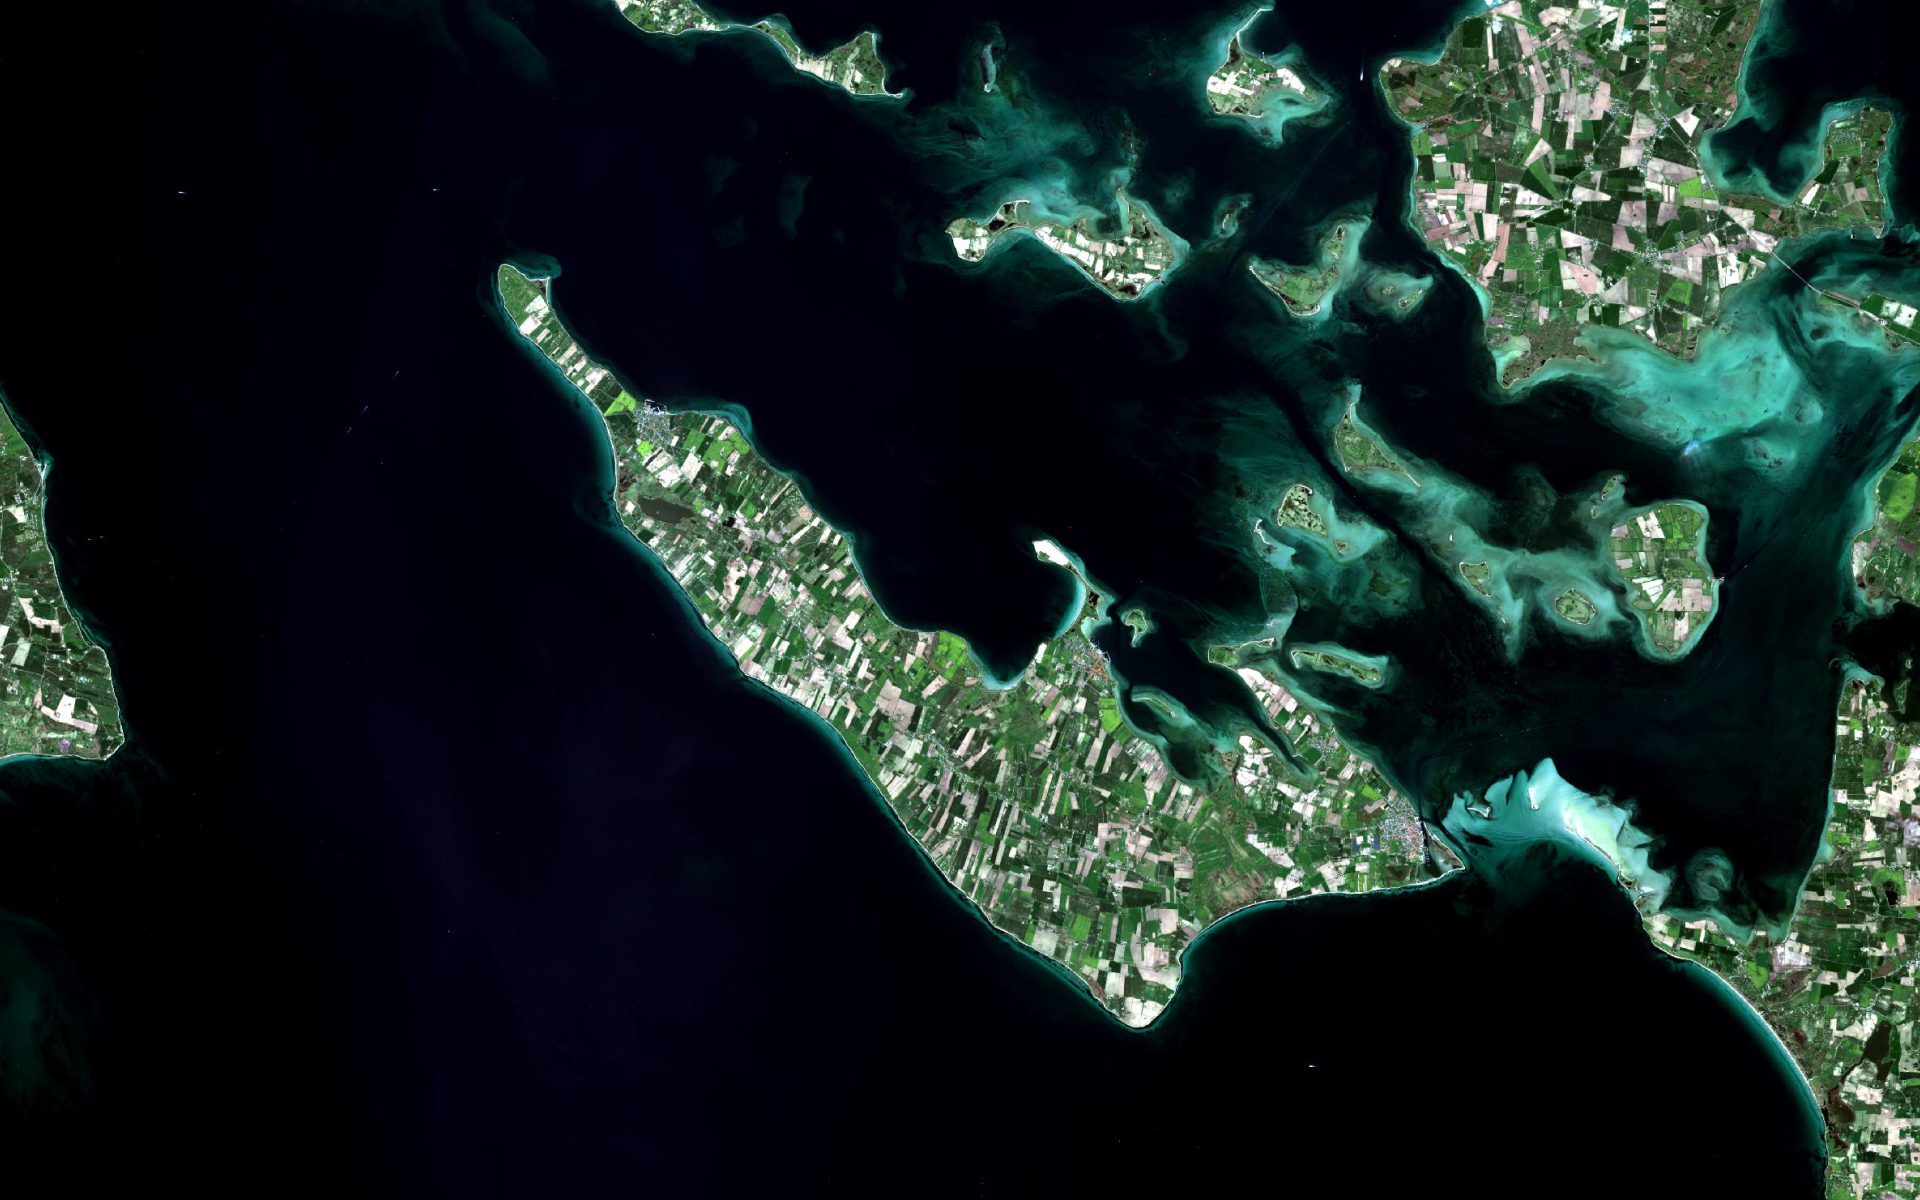
A powerful back-end image processing chain for handling petabytes of satellite data to validate parcel boundaries,  map and monitor crop types, grassland activity, harvest and ploughing and catch crops.

An advanced analytics toolbox for machine learning, deep learning and time series analysis and a sleek front-end web viewer for easy presentation of results and reporting.

A tailored and integrated solution conforming to local conditions and specific needs and requirements of the client. 

Typical customers?

National and regional paying agencies in the EU with a need to increase effectiveness in CAP monitoring in line with the requirements of the CAP2020 reform

Specifications

  • Six core CAP monitoring services:
      1. Parcel boundary validation
      2. Crop classification
      3. Grassland activity
      4. Ploughing
      5. Harvest
      6. Catch crops
  • Parcel level analysis as well as subparcel /pixelbased analysis and products – making best use of Sentinel 1/2, Landsat and commercial data sources, such as Planet data.

  • Markers updated on a daily basis and solution is operational on national scale
  • A sleek and customized interactive web viewer for easy data visualization, interpretation and reporting
  • The solution is available for any country or regional authority in the EU and flexible to be implemented based on the specific needs,  regulations, and regional conditions 

More information

Contact Lotte Nyborg (ln@dhigroup.com) for more information on VeriCAP.

EOatDHI part of the DHI GROUP

gras@dhigroup.com
+45 4516 9100

Agern Alle 5,
2970 Hørsholm,
Denmark

CVR: 36466871

VHR satellite imagery made easy!

Don't get lost in space

How to order and how to get more information about satellite imagery?

SATELLITE IMAGERY MADE EASY!

What you need to know!

Satellites provide us with a unique overview of our planet. About 5000 satellites are orbiting above us and about 700 of these specifically record earth observation data. As satellites continuously orbit the earth, they enable us to track physical trends, changes, and developments over long periods of time – and in great details. Satellites enable us to derive digital twins or our planet, and document all the change and dynamics on the surface – and this can be used for a wide range of applications.

We use the term spatial resolution to describe the level of detail seen in the images. Generally speaking, a higher spatial resolution enables us to see finer details on the surface. Very High Resolution (VHR) satellite images have a spatial resolution below 2 meters, and the best VHR sensors capture our planet in a 30 centimeter spatial resolution.

Temporal resolution is used to describe how often we are able to acquire a new image from the satellite over the same area. Some satellites will capture images of specific locations each day, some once a week – and some can be tasked specifically to take an image over a given area on a specific time on a specific day. The footprint of a satellite indicates the area of the earth covered by a single image. For some satellites, the footprint is several hundreds of square kilometers, and for some it is only a few square kilometers.

VeniceSentinel2
Venice, Italy, July 2018: Copernicus Sentinel 2 image (10 m resolution)
VenicePleides
Venice, Italy, July 2018: Pléiades image (50 cm resolution) ©Airbus
Artist's rendition of the WorldView-3 spacecraft in orbit (image credit: Maxar/DigitalGlobe)

What can we see and detect with VHR imagery?

The image below is taken from Maxar/DigitalGlobe’s Worldview-3, a very high resolution satellite. The spatial resolution is 30 cm, meaning each pixel in the image corresponds to a real world area of 30 cm x 30 cm.

These type of images can be used to identify archaeological markings or make use of the multi spectral bands in combination with artificial intelligence and machine learning to identify the species of trees and provide information about their overall health or estimate the potential yield of an entire orchard. High resolution images are available from commercial providers such as Maxar/DigitalGlobe, Airbus and Planet.

We can see:

    • Building and rooftop features
    • Solar panels and windows
    • Gardens and backyards
    • Sailing boats
    • Small landscape features
    • Individual trees
    • Cars and roads
    • Larger animals

We can not see:

    • The brand of solar panels
    • License plates
    • Car model
    • Individual people


São Paulo, Brazil, September 2014. WorldView-3 satellite (30 cm resolution) ©Maxar/DigitalGlobe

Highlights of VHR data

Satellite images are cheaper than you think

Satellites were once restricted to intelligence agencies and selected researchers.

Today, the developments within the space industry are driving the prices down, enabling the use of satellite images for almost everybody.

Available globally, at all times and at all scales

All places around the globe are equally accessible. Whether you need images of a suburb in Sydney or a forest in Siberia, these can be easily acquired by an imaging satellite.

The wide variety of satellites means you  can get the perfect images for your location, time frame and budget.

Easy to get, easy to use

Most providers will let you choose the areas and dates that you need online.

The images come in well-known formats such as GeoTiff or NetCDF, and can be loaded into your favourite GIS program.

Frequently Asked Questions (FAQ) about VHR imagery?

 
    • Is VHR satellite imagery expensive?
      Compared to traditional field surveys and aerial imagery, VHR satellite imagery offers a competitively priced alternative. This is particularly true when larger areas are required to be monitored, where the capacity of satellites to capture hundreds of kilometers in a single image provide significant cost savings.

      We offer archived 50 cm imagery from 10 €/km2 and new data acquisitions from 17 €/km2

    • Is VHR imagery available anywhere in the world?
      Yes, imagery can be provided for any location on earth.

    • I need imagery over an area at a specific date and time, is that possible?
      Yes, satellites acquire images across the planet in regular intervals (some daily, some weekly, …) however they can also be tasked to acquire imagery over a specific AOI at a specific date and time in the future.

    • Is cloud free conditions required for the satellites to acquire useable imagery?
      For optical imagery, cloud free conditions are required, however we also provide radar based alternatives (VHR SAR data) which is able to penetrate clouds and provide data regardless of weather conditions. 
 
    • Can I get access to free sample data?
      Yes, we can provide free sample data for you to explore  and test the data yourself. Fill in the form below and specify your request and we will get back to you as soon as possible.

    • How do I order imagery?
      Fill in the form below and specify your area of interest and data needs and we will get back to you as soon as possible with a quote and our advice on preferred data sources that best fits your needs and requirements.

    • Can you provide me with advise on what data to use?
      Our vast experience allows us to offer our customers independent and firm advice on which satellite images that would best fit the specific application area.


      Through our distribution agreements with almost all commercial satellite operators we make sure the latest news and details are available to our customers. 

Recording from QA webinar on VHR satellite data - 11 February, 2021

Want to know more about VHR satellite data? Need a quote for imagery? Want to see what’s available for your area?
Fill out this form and we’ll get back to you as soon as possible.


    WindSight – input for wind resource assessments

    Why is it important?

    Accurate estimations of wind energy resources are highly complex and time consuming - ultimately relying on consistent, accurate and timely input data. Yet, in many cases such data is inaccessible or simply not available and this may impact the ability of wind modelers to accurately assess wind resources.

    How can it help?

    The WindSight data package provides a new generation of satellite-based information products to improve wind resource assessments.

    WindSight includes 5 different high-quality and high-resolution data products on land cover, key forest characteristics, historical and future changes, topography and surface roughness. The core of the product suite includes the novel forest products which provide detailed inside on current and historical forest height and forest density, in grid sizes of 20 meters. Together with an improved 10 meter land cover product, these provide the backbone of the surface roughness product that provides accurate insight on roughness length - directly compatible as input for a wide range of software and modelling methods including WindPRO, WaSP and CFD tools.

    What you get!

    5 different high-quality and high-resolution data products – tailored for wind sites anywhere in the World.

    Analysis ready data compatible with WindPRO, WAsP, CFD tools and standard GIS software.

    Accurate, timely and low cost information on forest height and forest density, replacing the needs for most LIDAR campaigns.

    Typical customers?

    Wind energy developers use the data products for preliminary screening of wind site suitability for planning and prospecting. 

    Wind modellers use the advanced surface roughness data products in flow models, for improved accuracy of wind resource assessments. Testing at 10+ global wind energy sites has shown an improved accuracy of the modelled Annual Energy Production (AEP).

    Specifications

    Typically 10 meter resolution

    Data can be obtained for any onshore wind site in the world

    Cover large areas instantaneously to complement field data

    Go 40 years back in time to estimate long-term forest changes

    Monitoring information can be provided on a weekly basis

    Data available in a ready to use format for easy incorporation into existing GIS systems and databases

    Price list

    Contact us for a quote

    Visit us at our WindSight product page:

    EOatDHI part of the DHI GROUP

    gras@dhigroup.com
    +45 4516 9100

    Agern Alle 5,
    2970 Hørsholm,
    Denmark

    CVR: 36466871

    Deep Learning

    Why is it important?

    Information from space is becoming much more accessible with the exponential growth in number of satellites being launched together with advancements in Big Data and Cloud Computing.

    This allows for enormous quantities of data to be stored and analysed at a much faster pace and can lead to solving new challenges and optimise traditional ways of monitoring and mapping.

    How does it help?

    The common approach has been to train classical machine learning algorithms (e.g. Support Vector Machine or Random Forest) to label each pixel in a satellite image.

    However, one of the shortcomings of this approach is that each pixel in the image is classified independently of its neighbouring pixels – meaning the spatial context in imagery is not considered.

    The main advantage of Deep Learning algorithms is that they can recognize patterns, shapes, and context in imagery, and use this to better map different objects of interest.

    By doing so, they use not only the spectral information from pixels, but also the surrounding spatial information that is associated with objects.

    This extra information has provided a huge leap forward in computer vision capabilities and is used to more accurately identify specific objects and land cover classes of interest.

    What you get!

    Significant improvements in classification accuracy using the latest Deep Learning algorithms for image segmentation

    Successful object detection and recognition in satellite and aerial images even with limited training data available

    Significant improvements in mapping features in open landscapes using Deep Neural Networks

    Typical customers?

    Maritime industry for detection of reefs, hazardous objects, ships and illegal vessels

    Construction industry for detection of roads, built-up areas and general activity in construction zones

    Municipalities for detection of traffic patterns, car parks and illegal constructions

    Specifications

    We develop tailored solutions based on your specific needs.

    Price list

    Contact us for a quote.

    EOatDHI part of the DHI GROUP

    gras@dhigroup.com
    +45 4516 9100

    Agern Alle 5,
    2970 Hørsholm,
    Denmark

    CVR: 36466871

    Flood Risk and Hazard Mapping

    flood risk and hazard mapping

    Why is it important?

    Flood risk and hazard mapping is important for efficient flood risk management. The flood maps are used to prevent flood damages, for land use planning and rescue operations.

    How can it help?

    With satellite imagery it is possible to map the extent of an area that has been subject to either a flood or hazard, and assess the damage, getting a full overview of where aid is needed the most.

    What you get!

    Assess the amount of flooding in near real time by triggering satellites to map flooded areas. The flood hazard map can be acquired a few hours after flooding has occurred and delivered in less than 24-48 hours globally (different solutions apply)

    Prevent or limit floods from happening again by mapping historical flood hazards to understand the risks and take mitigating actions based on time series of satellite imagery​

    Using high-quality Digital Terrain Models suitable for assessing flood depth coupled with enhancement of Digital Elevation Models through advanced image analysis (feature extraction)

    flood risk and hazard mapping

    Typical customers?

    Urban planners to manage and understand the flood risks in urban planning zones

    Civil security agencies to asses the potential severity and frequency of flood losses in emergency situations

    NGOs and governments to map, plan and analyse flood risk problems from local to national scales

    Specifications

    Satellites and our services are global

    Get these type of maps daily depending on the overpass schedule of the different satellites

    Get information about historical floodings depending on availability of archived imagery

    The raw satellite image is typically available within hours after the image acquisition (time needed for analysis and production of maps can vary from a few hours to days depending on size of area)

    Price list

    Let us know in advance where and when you expect a flooding to occur and contact us for a quote!

    Visit us at our flood data portal:

    EOatDHI part of the DHI GROUP

    gras@dhigroup.com
    +45 4516 9100

    Agern Alle 5,
    2970 Hørsholm,
    Denmark

    CVR: 36466871

    Forest Monitoring with Satellites

    forest monitoring

    Why is it important?

    Forest monitoring with satellite data provide the consistent coverage needed to estimate forest cover area and forest cover changes over large areas.

    This information is critical for decision makers and practitioners to take timely actions to protect forests and to promote sustainable forest monitoring and management as each year millions of hectares of forests around the world are being lost or degraded due to deforestation and wildfires.

    How can it help?

    Accurate forest and land cover maps are needed to assist land use planning initiatives and support sustainable forest resource management. They are a necessity for understanding the impact of human land use and land cover change on hydrological processes and climate change.

    Earth observation can provide near real time alert information on forest disturbance which can help mitigate and assess damage from natural events (e.g. forest fires and storm damage) and forest encroachment due to unlicensed mining and agricultural activities.

    What you get!

    GIS maps to effectively share information about forest cover and land use

    Ability to visualize and analyze the location and pace of deforestation

    Better understanding of linkages between deforestation and issues such as e.g. forest fires and watershed hydrology

    Typical customers?

    Earth observation is often used in national forest inventory programs to complement traditional sample-based observations with estimates of forest area and/or volume per unit area
    Conservation agencies uses satellites to get timely information on forest cover changes within protected areas
    Monitoring and alert systems for storm and fire damage, estimation of changes in carbon stocks (e.g. REDD+) and to evaluate suppliers and their compliance with environmental standards

    Specifications

    Typically 10 meter resolution

    Data can be obtained from anywhere on Earth

    Cover large areas instantaneously to complement field data

    Go 40 years back in time to estimate long-term forest changes

    Monitoring information can be provided on a weekly basis

    All weather capacity mapping through clouds and at night with Synthetic Aperture Radar (SAR) data

    Data available in a ready to use format for easy incorporation into existing GIS systems and databases

    Price list

    Contact us for a quote

    EOatDHI part of the DHI GROUP

    gras@dhigroup.com
    +45 4516 9100

    Agern Alle 5,
    2970 Hørsholm,
    Denmark

    CVR: 36466871

    Crop Mapping Inventory

    Why is it important?

    Crop mapping inventory is needed for government and national purposes but is also equally important for agri-businesses, farmers and as an input to support subsidies and certification systems.

    Valuable information on crop status and growth development can be provided throughout the growing season to monitor crop progress and identify any signs of damage or stress.

    How does it work?

    Crop mapping refers to the inventory assessments of what is grown on the fields as well as the operational assessment of crop growth during a growing season.

    What you get!

    Up to date crop area and statistics of the major crop types

    In-season operational assessment of crop health and status

    Valuable information on crop type and acreage statistics can be provided on annual and semi-annual basis

    Typical customers?

    Agronomist can use crop inventory as input to models for the further assessment of harvest and yield prediction, soil productivity, or land use intensity

    Agencies use crop inventories to monitor and plan growing seasons and for EU regulations on subsidies for crops

    Agricultural companies such as fertilizer companies and seed producers can use crop information to better manage supply chains and improve sales

    Specifications

    Crop classification is benefitting from the recent surge in SAR and optical data availability, coupled with the development of advanced machine-learning classification algorithms.

    SAR data provides information relating to structural characteristics of crops, including size, density, orientation and surface roughness, while optical imagery provides data related to leaf pigmentation, cell structure and moisture content.

    We use a data fusion approach to crop classification as it offers the highest potential for accurate mapping. We have provided crop type mapping with average accuracies up to 95%.

    The main output attribute of the classification will be the predicted crop class for each field parcel in the control zone. As an additional source of information that can help to evaluate class confidence, we will include crop class probability values.

    Price list

    The production of custom tailored crop inventory is between 1.5 and 2.5 Euro/km2.

    For operational crop monitoring please contact us.

    EOatDHI part of the DHI GROUP

    gras@dhigroup.com
    +45 4516 9100

    Agern Alle 5,
    2970 Hørsholm,
    Denmark

    CVR: 36466871

    Water Quality

    Satellite data analysis

    Why is it important?

    Having access to near real-time information about the conditions of water quality and its distribution is essential to proactively manage risks and improve responses to water incidents, such as algal blooms, red tides or sediment plumes.

    Remote-sensing is the only practical and economical method to detect the quality of marine environments as well as remote and large inland waters where frequent in situ sampling is impossible. Satellite-image archives enable change detection of previously unmeasured or un-monitored water bodies.

    How does it work?

    At DHI GRAS we process satellite imagery with state-of-the-art algorithms to produce accurate and seamless maps on water quality, such as chlorophyll concentrations or suspended matter content.

    These maps enable assessments of the current and historic state of the water quality and its variability in space and time, which is key for impact assessments, early warnings, environmental monitoring as well as water resource management.

    What you get!

    Detailed and customised mapping of the water quality in your water environment with very fast turn-around time

    Insights into historical water quality conditions and comparison with present information

    Seamless integration of information from Earth Observation and in situ monitoring into your decision support system

    Typical customers?

    Contractors to survey the impact of construction work in marine environments

    Authorities to complement or redesign traditional water quality monitoring for their monitoring obligations, e.g. for the Water Framework Directive or support early warnings of occurrences of algae blooms, red tides and sediment plumes

    Aquaculture farmers to monitor water condition and its variability in space and time or support site selection decisions

    Specifications

    Depending on the aim of the monitoring and the desired spatial resolution, the temporal frequency ranges from daily to annual and the spatial resolution from 10-300 meters

    All data can be aggregated according to customer specifications, such as seasonal means, monthly means etc.

    In general, satellites provide information on the uppermost layer of the water body

    Please contact us for more information

    Price list

    Contact us for a quote

    EOatDHI part of the DHI GROUP

    gras@dhigroup.com
    +45 4516 9100

    Agern Alle 5,
    2970 Hørsholm,
    Denmark

    CVR: 36466871

    Satellite Imagery

    Satellite data analysis imagery images

    Why is it important?

    Satellite imagery is a highly valuable source of information as the applications are many and can be tailored to the individual project.

    Traditional field surveys to monitor areas and projects are costly and time-consuming, whereas this solution gives you the information you need at a similar price but much faster.

    With satellite imagery you can track the local environment, the progress of your infrastructure project or urban developments. It also allows for comparison with archived data and depicts large and remote areas.

    How does it work?

    DHI GRAS is working together with the world’s leading providers of satellite imagery to increase the access to the continuously growing field of satellite data.

    Due to the recent improvements in spatial resolution, satellites are now a competitive alternative to aerial photography and field visits in many different applications. An array of different satellites ensures your specific needs will be covered.

    Our vast experience allows us to offer our customers an independent and solid advice on which satellite image that would fit the specific purposes best.

    Through our distribution agreements with almost all commercial satellite operators we make sure the latest news and details are available to our customers.

    What you get!

    A product that fits into all types of GIS applications and other software packages

    Access to independent and experienced advice on which satellite imagery fits your project the best

    Access to a large portfolio (+50) of radar imagery with all-weather image capabilities

    Typical customers?

    Municipalities looking for a cost-efficient overview of their area

    Researchers looking for detailed imagery for research purposes

    Planners looking for detailed insights for remote sites before field surveying and construction activities

    Specifications

    WorldView-2: multispectral imagery at 1.8 meter resolution and panchromatic imagery at 0.46 meters

    QuickBird: 60 cm resolution (panchromatic and pansharpened) and 2.4 m multispectral

    GeoEye-1: 0.4 m resolution (panchromatic and pansharpened)

    Ikonos: 4 m multispectral

    RapidEye: 5 m

    Pleiades: 4 band data at 2 m resolution and panchromatic data at 0.7 m

    Price list

    Get archived optical data products from €10/km² with a spatial resolution from 0.5 m

    Get new optical data acquisition from €17/km² with a spatial resolution from 0.5 m

    EOatDHI part of the DHI GROUP

    gras@dhigroup.com
    +45 4516 9100

    Agern Alle 5,
    2970 Hørsholm,
    Denmark

    CVR: 36466871

    Satellite-derived Bathymetry

    Why is it important?

    Coastal environments are some of the most dynamic and constantly changing regions of the globe. Monitoring and mapping these changes is critical to environmental studies and construction activities such as harbours, pipelines and other critical infrastructure in the coastal zone and shallow off-shore areas.

    A significant part of the worlds coastal region is still poorly mapped, or the mapping is significantly outdated. Navigating in poorly mapped or dynamic areas can be supported with up-to-date satellite-derived water depths. The quick turnaround allows for quick delivery of up-to-date information as support to time-critical situations such as disaster relief following natural disasters where existing map material may have become outdated.

    How does it work?

    At DHI GRAS, we have developed a cost-effective method for accurate water depth mapping based on high resolution satellite images. Based on over 10 years of research and project activities we have developed an approach that exploits all the newest satellite systems.

    Our proprietary state-of-the-art physical modelling method secures highly accurate deliveries. The approach is globally applicable, and we have helped clients all over the world from the polar regions to the tropics.

    Satellite-derived bathymetry is a cost-effective approach to detailed mapping of the worlds shallow areas. Unlike field-based surveys the solution has a quick turnaround, no health and safety issues and requires no permits.

    Since it is based on satellite information it is also ideal for remote areas and harsh environments.

    What you get!

    Very detailed mapping of the coastal and nearshore area in 2 to 10 meter spatial resolution 

    Very fast turn-around time no matter the location

    Our proprietary methods and rigorous quality assessment ensures high quality data deliveries

    Senior Project Manager,
    Niras

    Klavs Bundgaard

    NIRAS has used high resolution bathymetry data from DHI GRAS for a detailed wave and water level study in Denmark. The bathymetry data was derived from satellites in an impressive high resolution. With the surface coverage, it was possible to see detailed morphological variations such as longshore bars, sand waves and other similar features, which are not normally seen in traditional measurements with that level of detail. It clearly made the subsequent modelling much more valid. The product is price-wise very competitive compared to traditional survey methods.

    Typical customers?

    Widely used by the modelling community where accurate bathymetry is required for any high quality hydrodynamic modeling of the coastal zone

    Engineering companies working in the coastal zone use our data in the initial planning phase and as a first screening before conducting costly field campaigns

    National authorities and hydrographic offices get up-to-date information about territorial waters and minimize navigational hazards within their area of responsibility

    Specifications

    We are industry leading providers of satellite-derived bathymetry

    Our solution is based on more than 10 years of research and development funded by European Commission, European Space Agency, national authorities and internal funds

    We have a proven track record with satisfied clients all over the world

    We have a fast turn-around on all deliveries

    We offer a cost efficient and industry leading high-quality product

    Globally applicable where conditions allow it

    All data undergo a very thorough quality

    Every data point comes with an associated derived uncertainty measure

    Price list

    Available resolutions:

    2-m resolution

    10-m resolution

    Price range depends on size of Area of Interest

    Contact us for details and custom quotes

    Visit us at our bathymetry data portal

    EOatDHI part of the DHI GROUP

    gras@dhigroup.com
    +45 4516 9100

    Agern Alle 5,
    2970 Hørsholm,
    Denmark

    CVR: 36466871