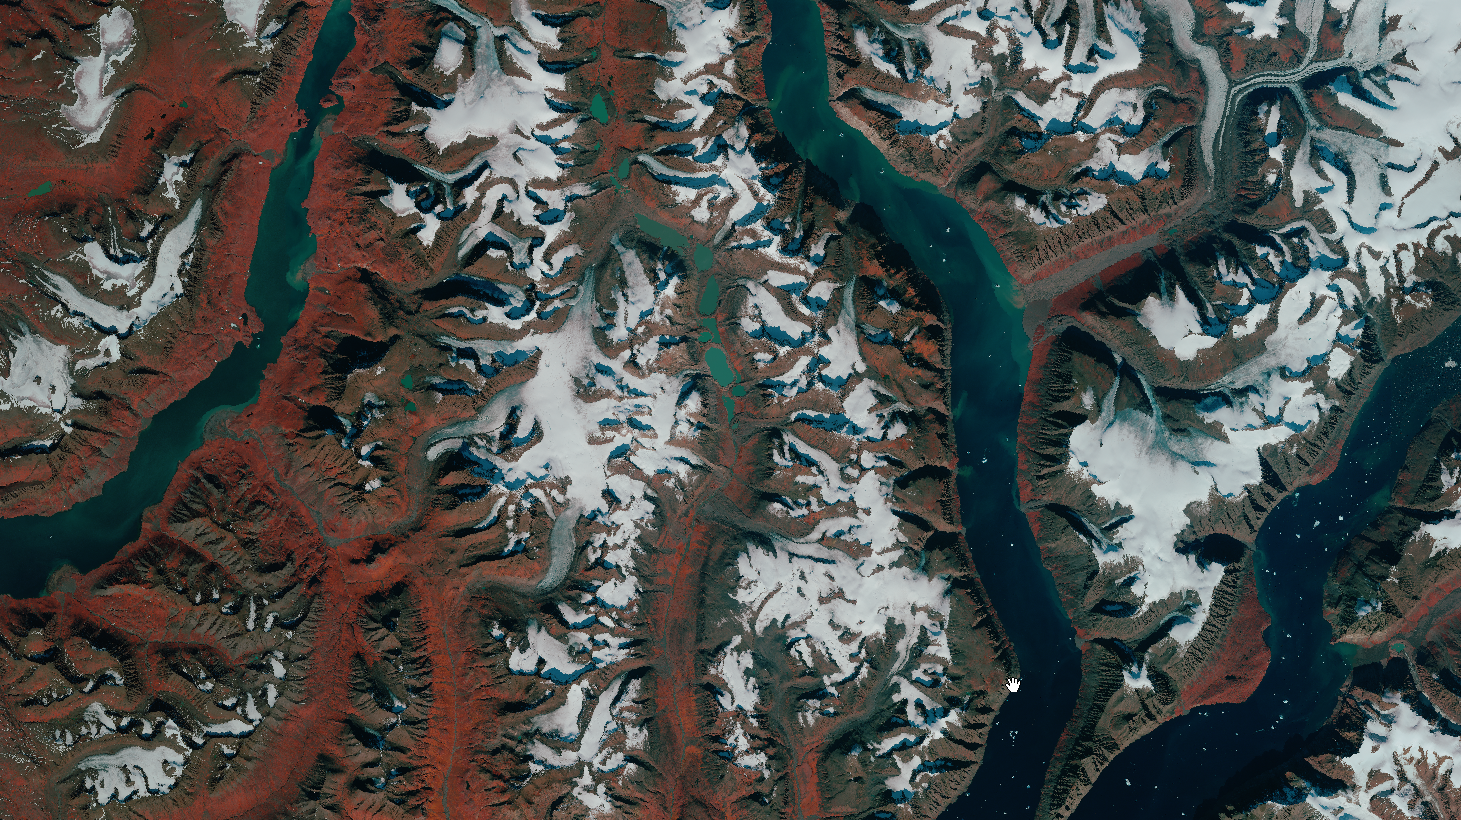
Provision of detailed satellite imagery and digital elevation models covering 85.000 sqkm of Greenland

Up to date view of ice free Greenland 2020
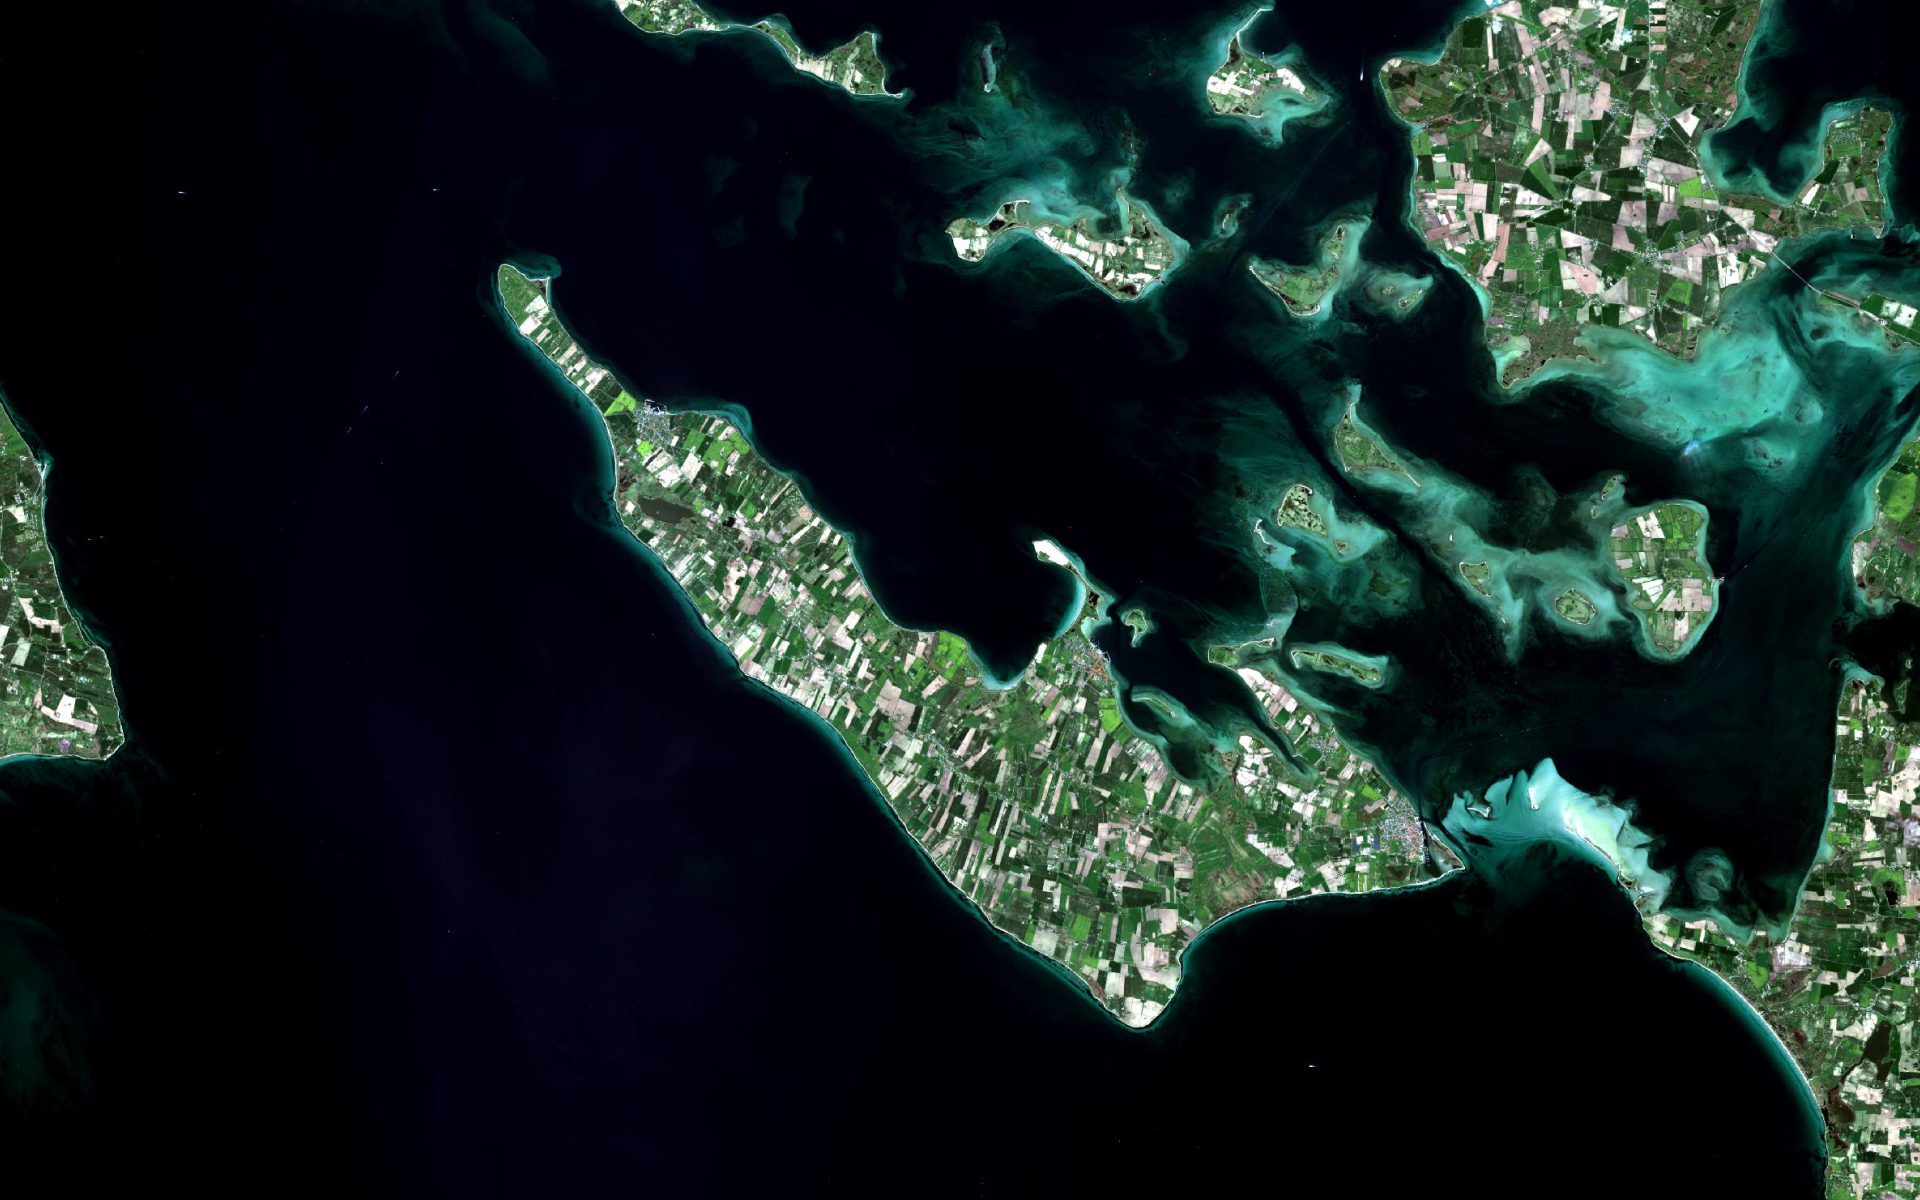
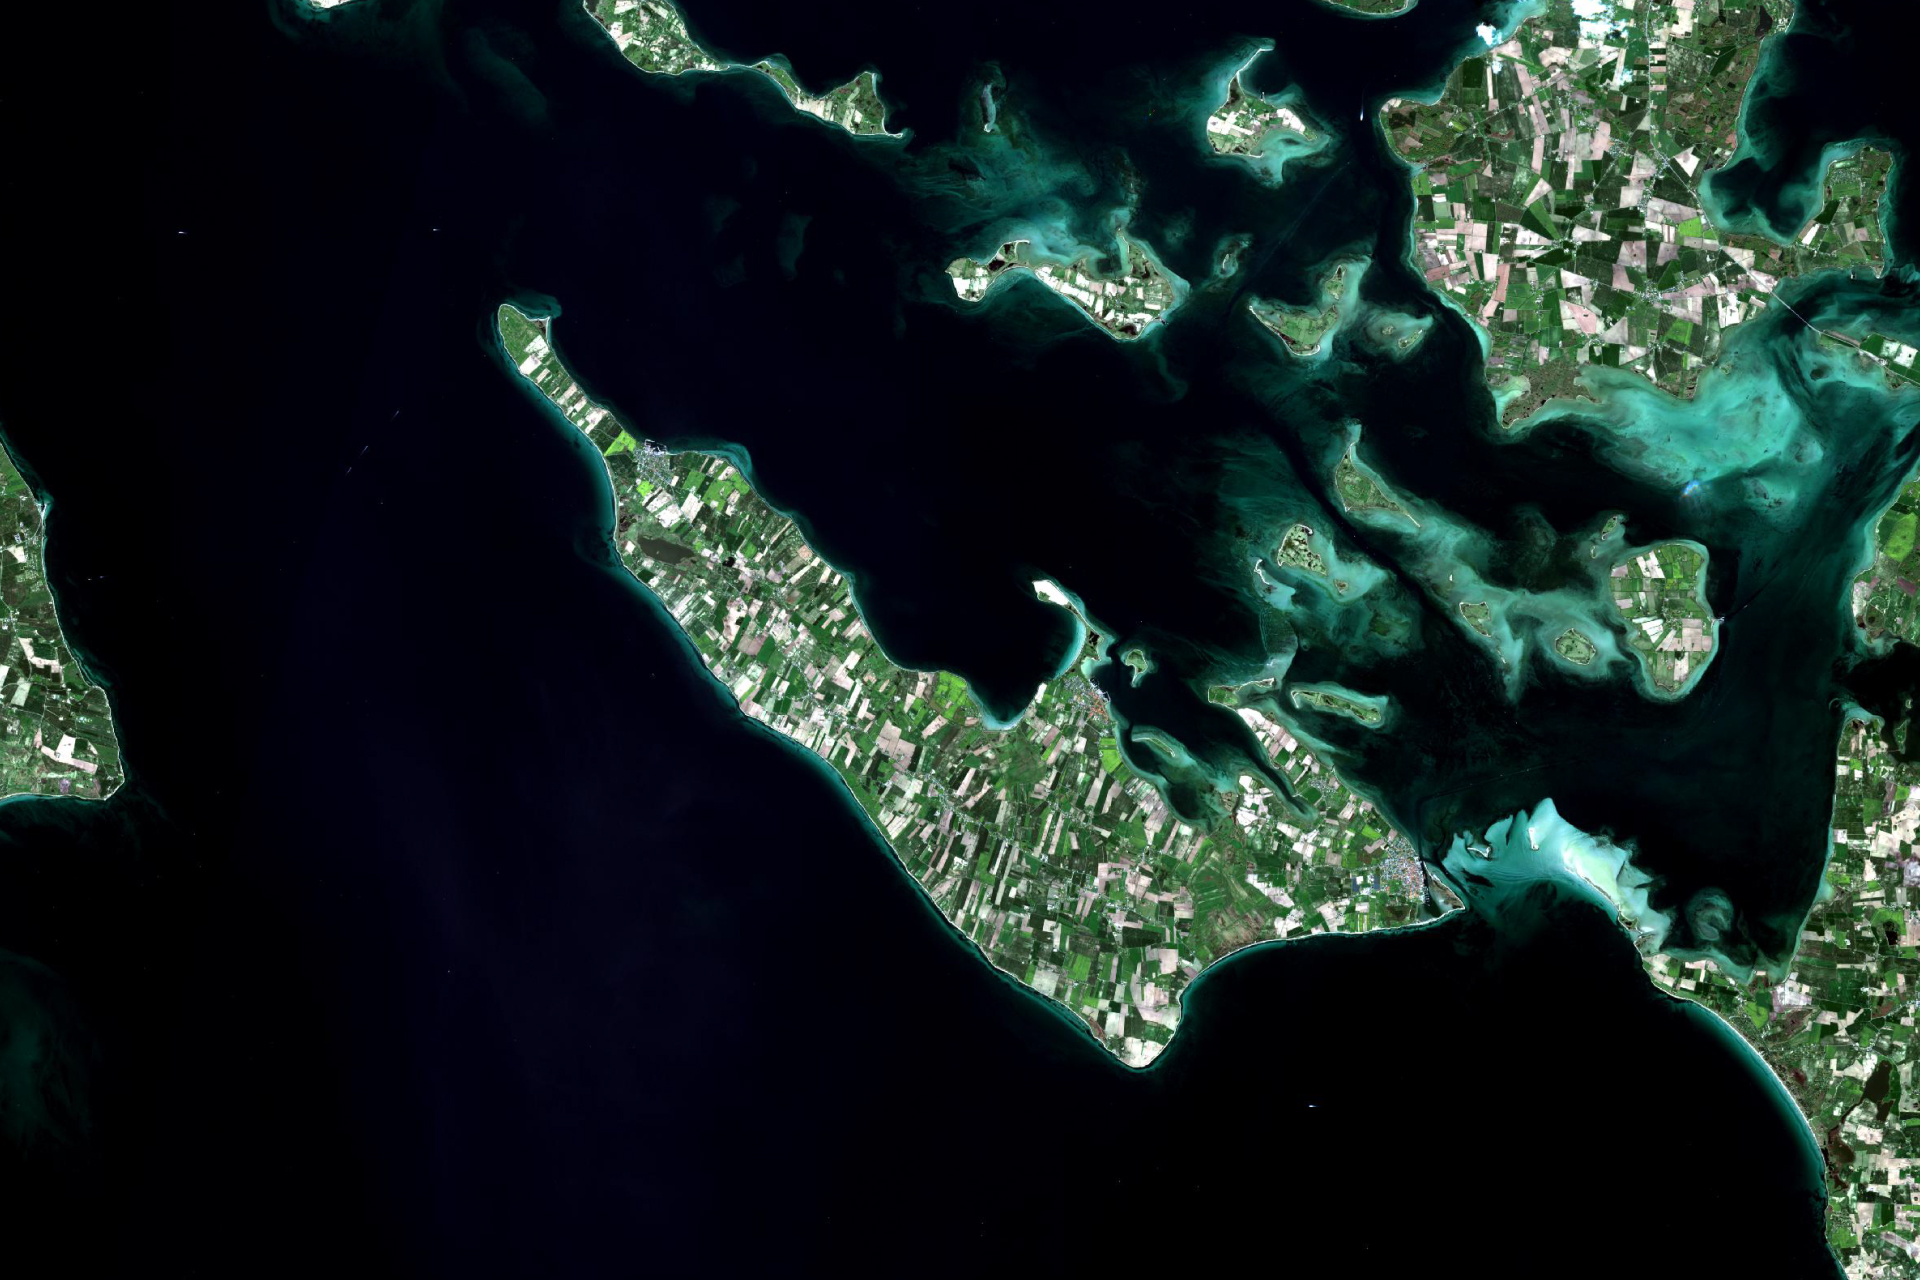
Provision of updated optical orthophoto mosaics, with a spatial resolution of 1.6m, covering over 225.000 km2 of Greenland
Why is it important?
Topographic maps of Greenland are generally outdated, and the positional accuracy often inadequate, in the open land outside the main settlement areas.
This means that critical decisions relevant for public administration and environmental regulation are often based on inadequate data and information, thus impeding the ability of authorities to make informed and data driven decisions rooted in the best possible data.
The new up to date orthophoto mosaics based on the latest satellite imagery from the Airbus Spot 6/7 satellites will contribute to address this gap by providing a fresh view of the ice-free areas of Greenland.
Project highlights:
Provision of very high resolution satellite imagery covering 225.000 km2 of Greenland
Advanced large scale data processing to produce seamless cloud-free, orthorectified and color optimized image mosaics covering the entire 225.000 km2.
Independent advice and support on satellite data selection and processing, drawing upon more than 20 years’ experience
In more detail..
Since 2015, DHI GRAS has supported the Danish Agency for Data Supply and Efficiency (SDFE), in close cooperation with Greenland’s Government, in their mission to provide updated topographic maps of the ice-free areas of Greenland.
The current topographic maps of Greenland are based on data collected in the 1930s and 1970-80s and they are inaccurate both in terms of elevation, distance and geolocation. However, Greenland is a large country and combined with the extreme conditions, dark polar winters and frequent cloud cover makes it difficult and costly to map at scale through traditional means.
Through previous pilot projects (undertaken in collaboration with Airbus on behalf of SDFE), we have provided ready-to-use orthomosaics and detailed Digital Elevation Models (DEM) for an area covering 85.000 sqkm of Greenland, successfully demonstrating the viability and potential of satellite imagery as a solution to the existing data gap.
In this project (in collaboration with Airbus) we will deliver updated satellite ortho image mosaics for the majority of the ice-free areas of Greenland – covering an extent of more than 225.000 km2.
These new data, providing a fresh view of Greenland, will underpin efforts to update existing topographic maps, thus contribute to support informed decision making and make it easier and more secure to navigate in the vast Greenlandic nature.
In partnership with
Danish Agency for Data Supply and Efficiency:
The Danish Agency for Data Supply and Effeciency (SDFE) provides high-quality data to the public and private sectors, enabling them to make important community decisions on the best possible basis.
SDFE is an agency that spans broadly across public administration and is part of the Danish Ministry of Climate, Energy and Utilities.
Related items
Fresh views on Greenland – updated satellite imagery successfully delivered
Imagine the powerful combination of a living digital library documenting the entire planet every day. Read more about EO and deep learning.
DHI GRAS part of a new partnership to promote satellite solutions in the Arctic
As part of our continuous and long-term commitment to enhance opportunities in the Arctic, making best use of satellite data, we are proud to be part of the newly established Danish Partnership for space in the Arctic ‘Kongeriget Danmarks Partnerskab for Rum i Arktis’.
Updated satellite-based maps of Greenland
Provision of detailed satellite imagery and digital elevation models covering 85.000 sqkm of Greenland Updated
EOatDHI part of the DHI GROUP
gras@dhigroup.com
+45 4516 9100
Agern Alle 5,
2970 Hørsholm,
Denmark
CVR: 36466871