Your geodata on the web
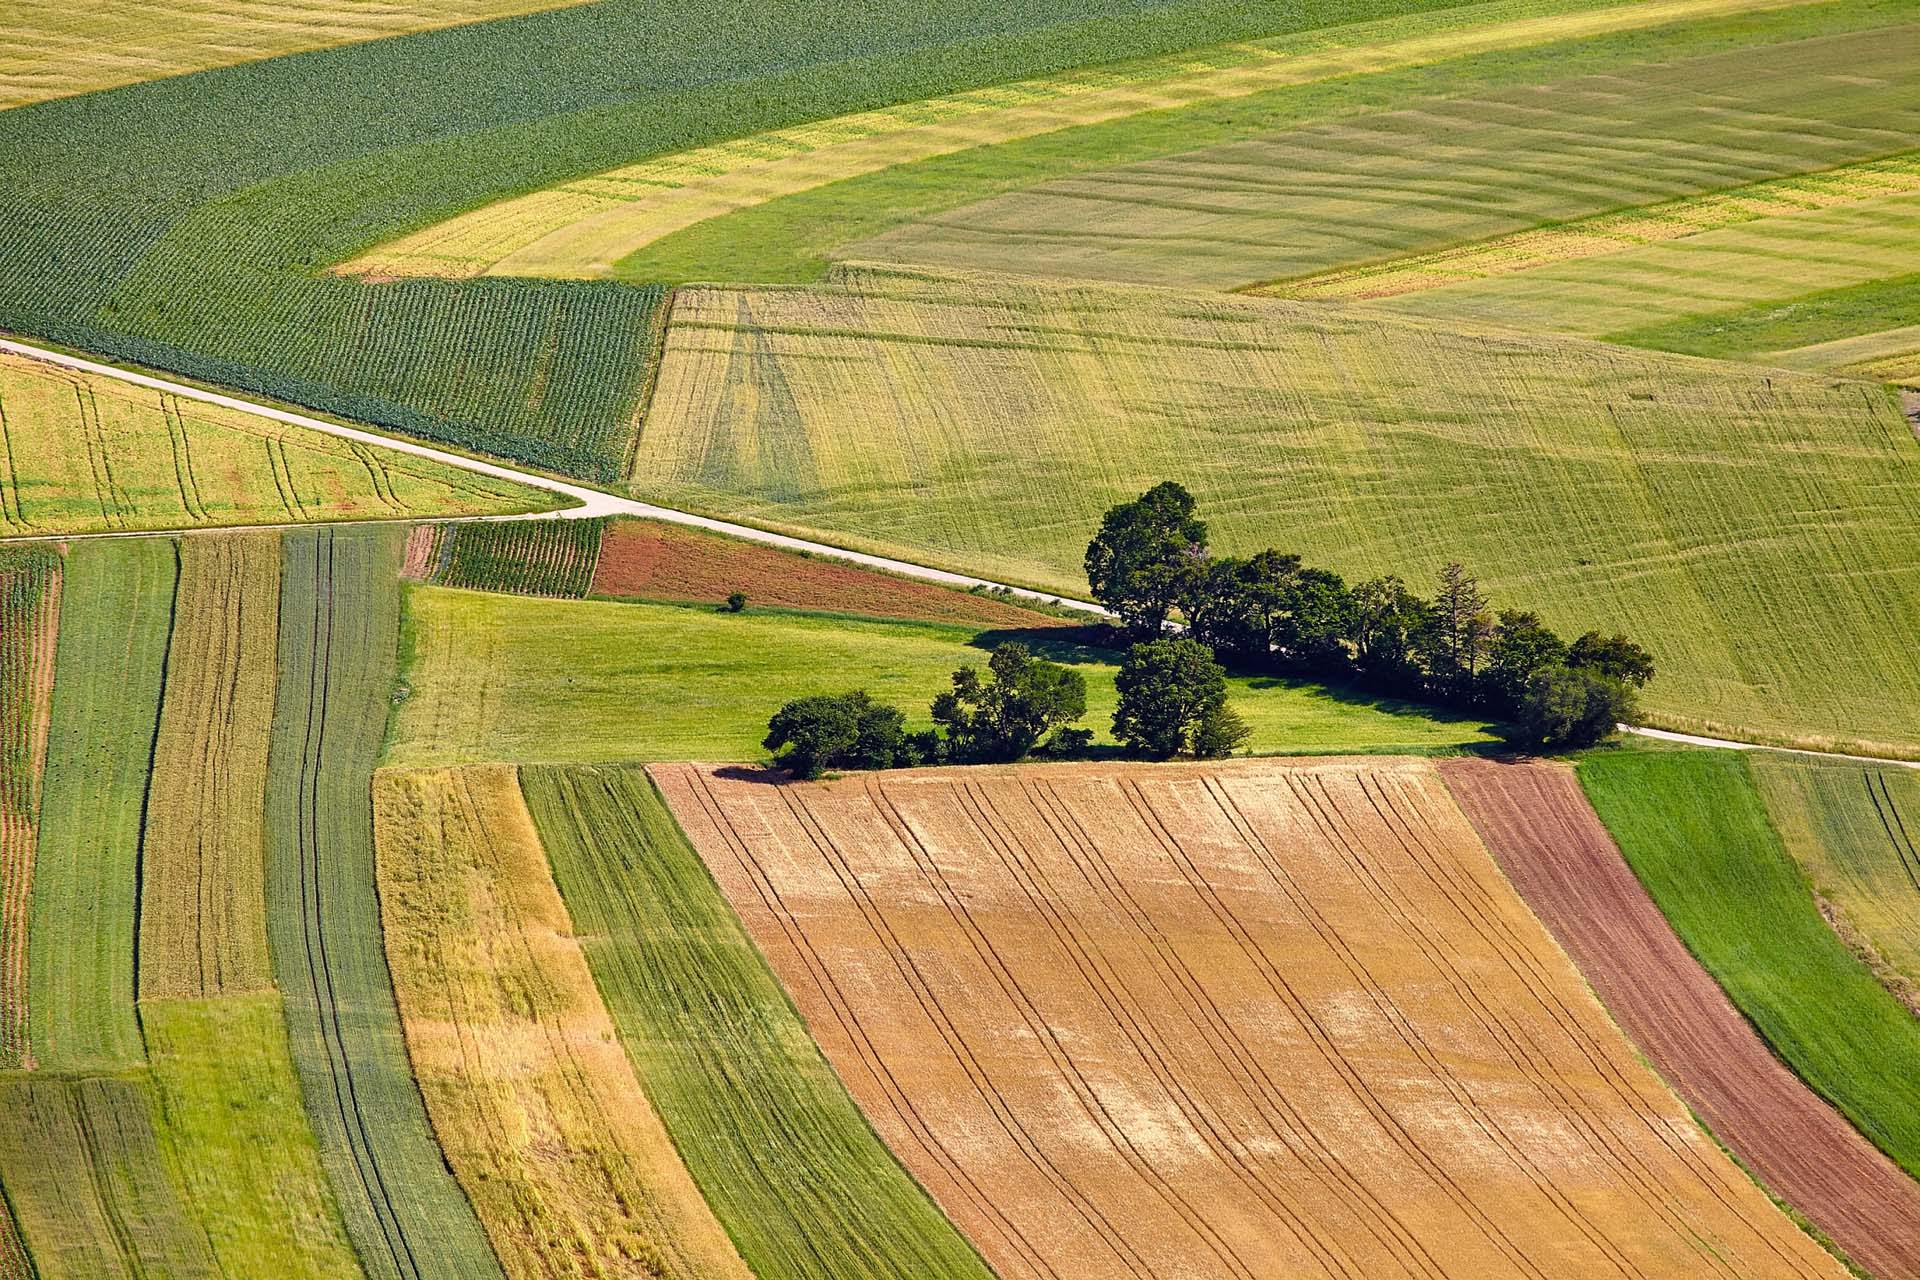
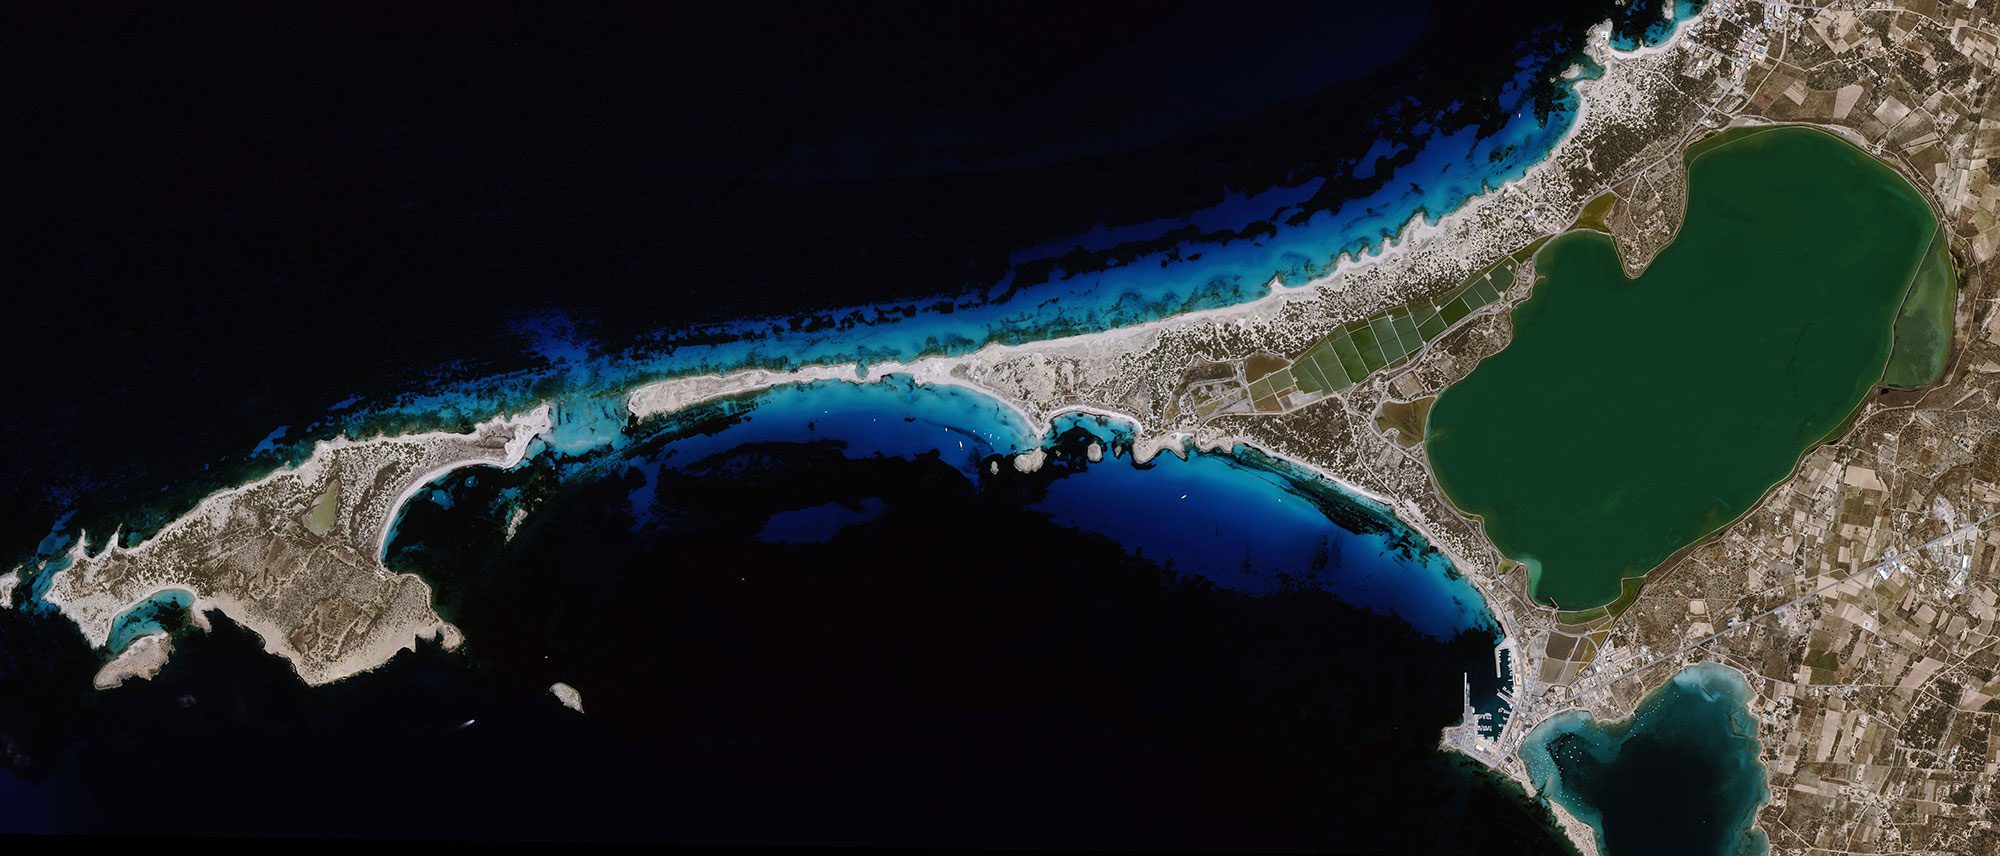
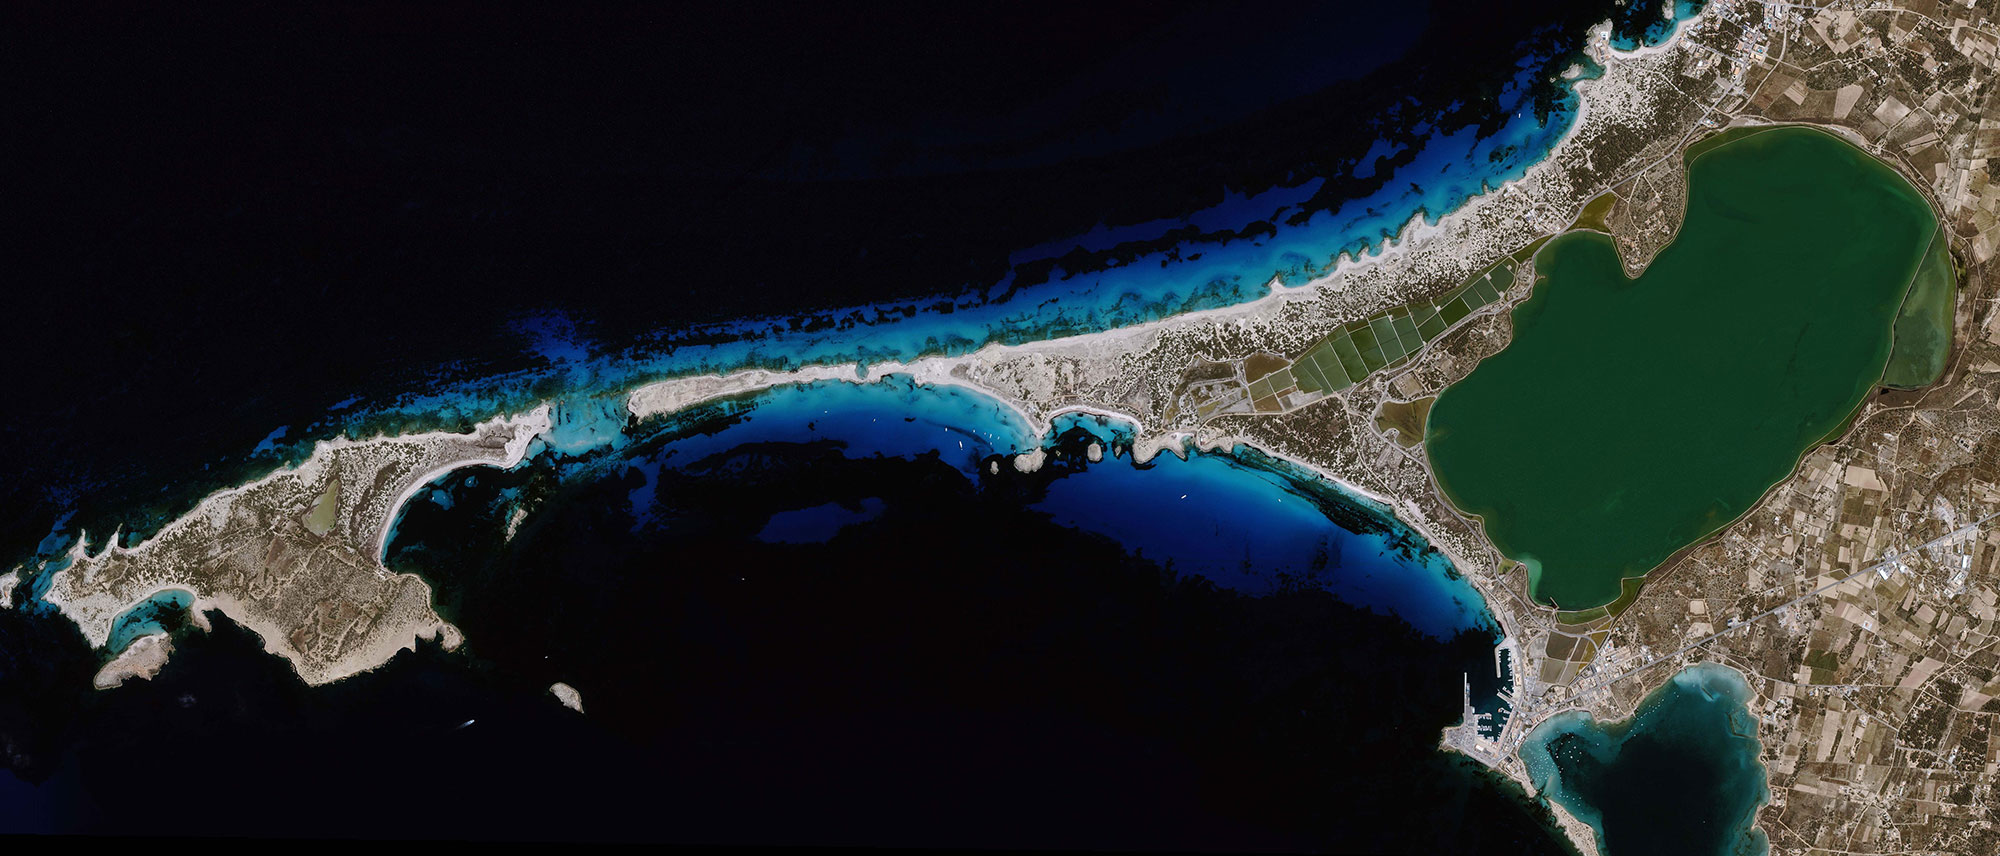
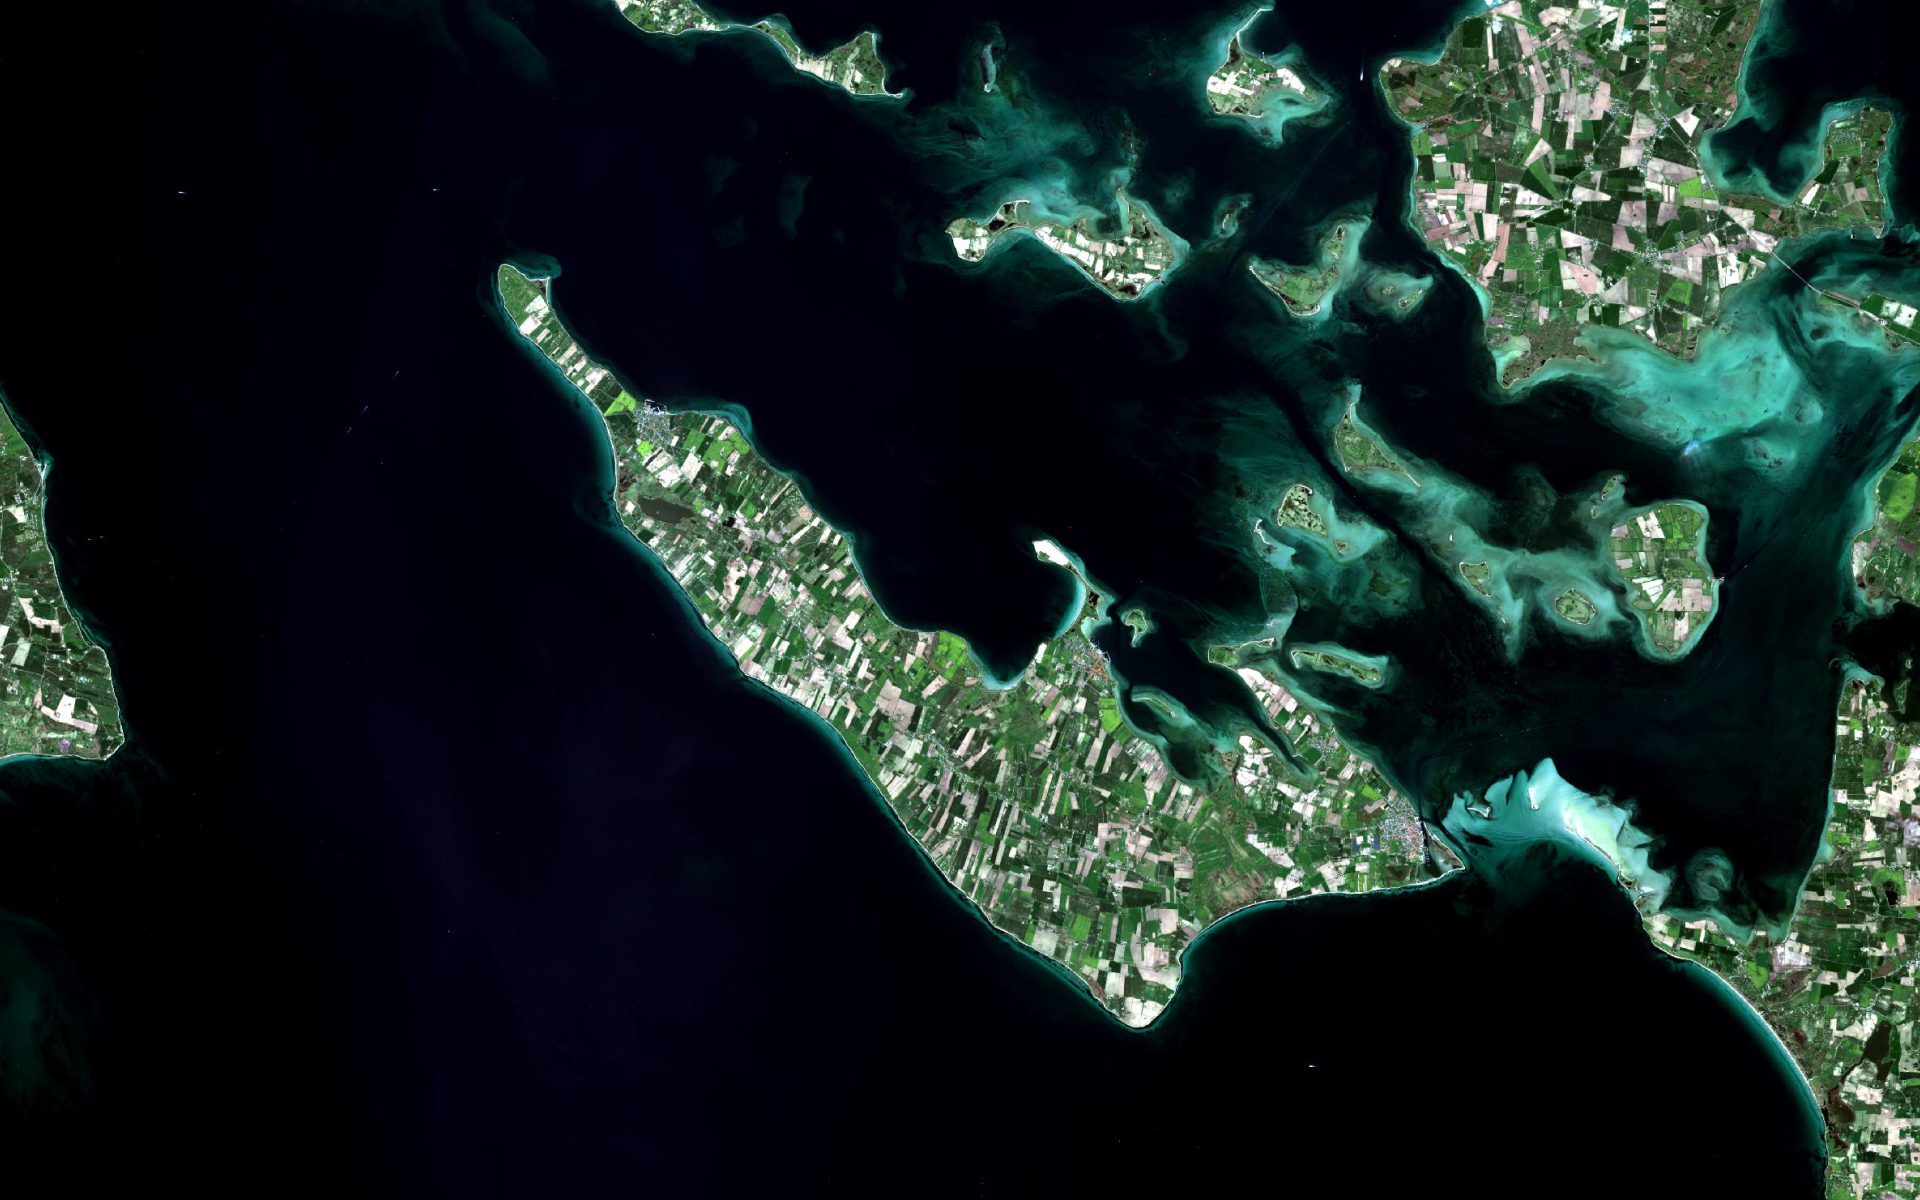
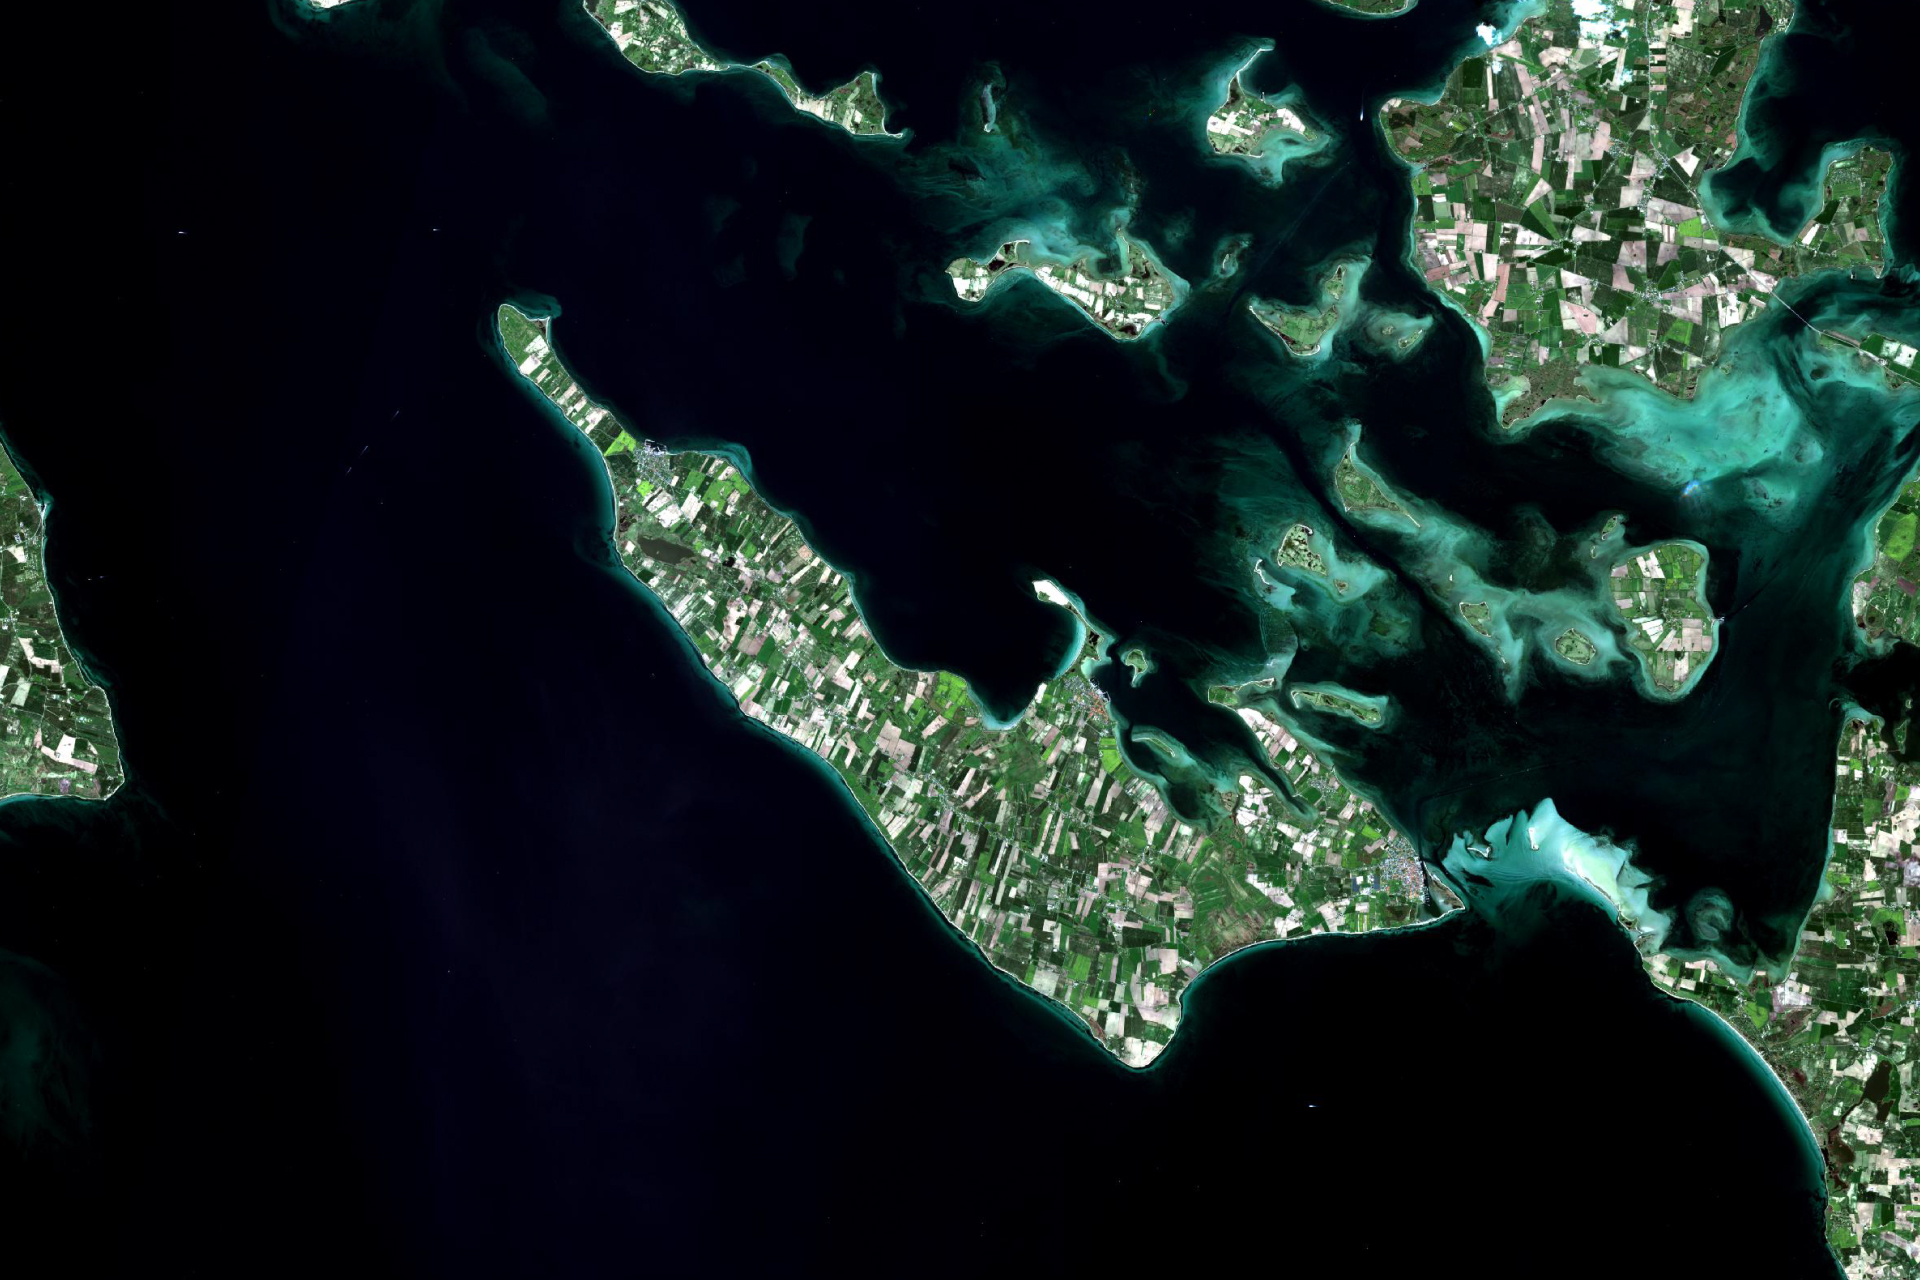
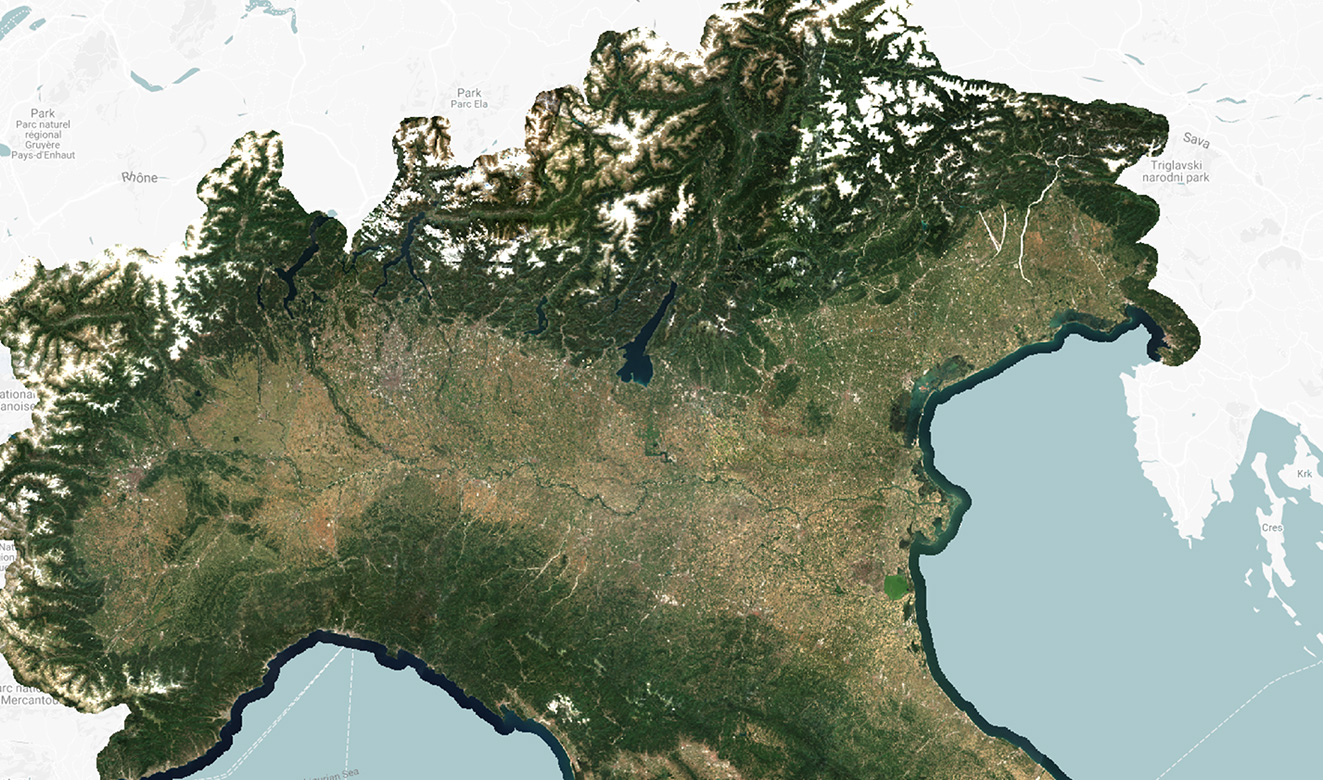
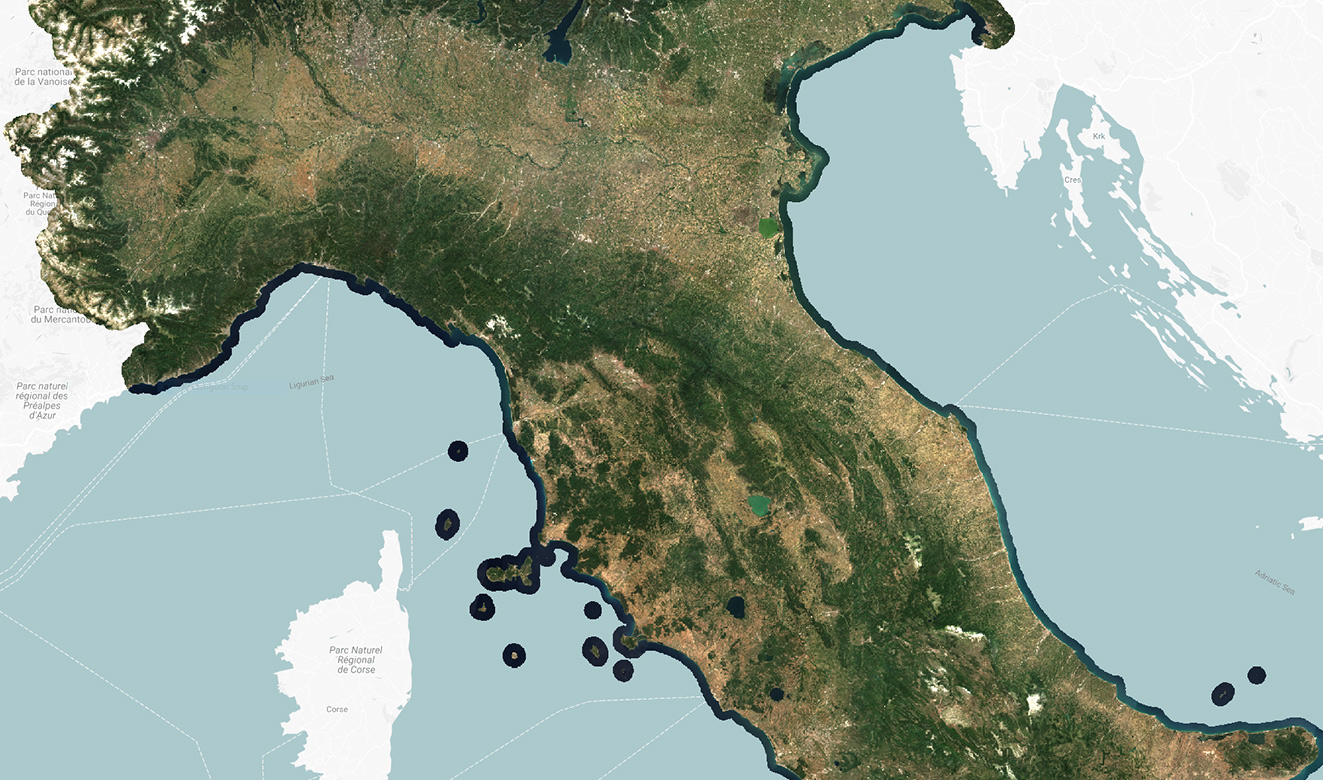
geodata

Why is this important?

Easy access and visualization of geodata is as important as the actual analysis and processing of the data itself. We build modern and intuitive web apps that fit your needs, whether it’s an internal tool for your analysts to query data, or a simple and elegant app for visualizing results.

The solution can be based on tried and true analysis methods or modern AI and machine learning. Our analysts and software developers work together to transform it into an algorithm which can be deployed operationally. We automate the entire pipeline, from acquisition to analysis and visualization.

The highlights:

An algorithm built to solve your exact problem

A modern and elegant web app custom-built to suit your end-users

A modern and elegant web app custom-built to suit your end-users

In more detail..

We build entire geodata web solutions into one package. Data acquisition from relevant sensors and satellites, analysis using our state of the art algorithms and AI, all the way to displaying the data in a custom-built web app, using our own open source raster server.

At DHI GRAS we have experts in both geodata analysis, software- and web development. We leverage this to provide you with a full package solution. We aim for full automation, seamlessly streaming results to your app as soon as they are processed.

EOatDHI part of the DHI GROUP

gras@dhigroup.com
+45 4516 9100

Agern Alle 5,
2970 Hørsholm,
Denmark

CVR: 36466871

Wetland Monitoring with Earth Observation Data

wetland monitoring

Why is this important?

The project has demonstrated how Earth Observation (EO) can support wetland monitoring in Uganda and with continued training sessions can become a valuable tool for wetland managers and practitioners, not only in Uganda, but potentially also paving the way for other East African countries to achieve a wetland inventory in the future.

The highlights:

Delivering a toolbox for wetland inventory mapping and demonstrating how Earth Observation can provide a full national wetland inventory in Uganda

Online portal for SDG reporting on SDG indicator 6.6.1 on wetland extent

Training national stakeholders in Uganda, and other RAMCEA countries, and providing a “lessons learned” and “roadmap” document for roll-out of the method, toolbox and online portal to other RAMCEA countries

In more detail..

The project was a unique demonstration of the full implementation of using Earth Observation to support the monitoring of wetland ecosystems on the national scale in Uganda.

Wetland monitoring is crucial for conservation and restoration of wetland ecosystems in Uganda which is explicitly mentioned in the national development plans. Hence, monitoring and reporting is not only important for reporting on the Sustainable Development Goal indicators, but should be anchored within and used by the national agencies to avoid further degradation of wetlands.

Within this project, a national baseline mapping of wetlands in Uganda was performed for 2016-2017 using all available Sentinel-1 and Sentinel-2 imagery to act as a baseline for SDG indicator reporting.

This also included a training component with three training courses, leveraging the GlobWetland Toolbox for doing national-scale wetland mapping and the inclusion of field data for classifier training and product validation, where the engagement of the local stakeholders and experts are key.

The open source toolbox provided to the local stakeholders consists of a specific component producing statistics and reports for SDG reporting which can be used by e.g. the Uganda Bureau of Statistics who are responsible for the SDG indicator reporting at the national level.

This is available from the online portal where the data, statistics and reports can be explored by users and agencies.

One of the other key aims of the project was to use the implementation in Uganda as demonstration case for uptake of the tools and methods by the other RAMCEA member countries. This was obtained through participation of key staff from the other RAMCEA countries in the training workshops, and by delivering guidance documents on “lessons learned” and “roadmap” for a roll-out.

The online portal for the project is now operated by the Ministry of Water and Environment in Uganda.

EOatDHI part of the DHI GROUP

gras@dhigroup.com
+45 4516 9100

Agern Alle 5,
2970 Hørsholm,
Denmark

CVR: 36466871

Forest Monitoring with Satellites

forest monitoring

Why is it important?

Forest monitoring with satellite data provide the consistent coverage needed to estimate forest cover area and forest cover changes over large areas.

This information is critical for decision makers and practitioners to take timely actions to protect forests and to promote sustainable forest monitoring and management as each year millions of hectares of forests around the world are being lost or degraded due to deforestation and wildfires.

How can it help?

Accurate forest and land cover maps are needed to assist land use planning initiatives and support sustainable forest resource management. They are a necessity for understanding the impact of human land use and land cover change on hydrological processes and climate change.

Earth observation can provide near real time alert information on forest disturbance which can help mitigate and assess damage from natural events (e.g. forest fires and storm damage) and forest encroachment due to unlicensed mining and agricultural activities.

What you get!

GIS maps to effectively share information about forest cover and land use

Ability to visualize and analyze the location and pace of deforestation

Better understanding of linkages between deforestation and issues such as e.g. forest fires and watershed hydrology

Typical customers?

Earth observation is often used in national forest inventory programs to complement traditional sample-based observations with estimates of forest area and/or volume per unit area
Conservation agencies uses satellites to get timely information on forest cover changes within protected areas
Monitoring and alert systems for storm and fire damage, estimation of changes in carbon stocks (e.g. REDD+) and to evaluate suppliers and their compliance with environmental standards

Specifications

Typically 10 meter resolution

Data can be obtained from anywhere on Earth

Cover large areas instantaneously to complement field data

Go 40 years back in time to estimate long-term forest changes

Monitoring information can be provided on a weekly basis

All weather capacity mapping through clouds and at night with Synthetic Aperture Radar (SAR) data

Data available in a ready to use format for easy incorporation into existing GIS systems and databases

Price list

Contact us for a quote

EOatDHI part of the DHI GROUP

gras@dhigroup.com
+45 4516 9100

Agern Alle 5,
2970 Hørsholm,
Denmark

CVR: 36466871

Crop Mapping Inventory

Why is it important?

Crop mapping inventory is needed for government and national purposes but is also equally important for agri-businesses, farmers and as an input to support subsidies and certification systems.

Valuable information on crop status and growth development can be provided throughout the growing season to monitor crop progress and identify any signs of damage or stress.

How does it work?

Crop mapping refers to the inventory assessments of what is grown on the fields as well as the operational assessment of crop growth during a growing season.

What you get!

Up to date crop area and statistics of the major crop types

In-season operational assessment of crop health and status

Valuable information on crop type and acreage statistics can be provided on annual and semi-annual basis

Typical customers?

Agronomist can use crop inventory as input to models for the further assessment of harvest and yield prediction, soil productivity, or land use intensity

Agencies use crop inventories to monitor and plan growing seasons and for EU regulations on subsidies for crops

Agricultural companies such as fertilizer companies and seed producers can use crop information to better manage supply chains and improve sales

Specifications

Crop classification is benefitting from the recent surge in SAR and optical data availability, coupled with the development of advanced machine-learning classification algorithms.

SAR data provides information relating to structural characteristics of crops, including size, density, orientation and surface roughness, while optical imagery provides data related to leaf pigmentation, cell structure and moisture content.

We use a data fusion approach to crop classification as it offers the highest potential for accurate mapping. We have provided crop type mapping with average accuracies up to 95%.

The main output attribute of the classification will be the predicted crop class for each field parcel in the control zone. As an additional source of information that can help to evaluate class confidence, we will include crop class probability values.

Price list

The production of custom tailored crop inventory is between 1.5 and 2.5 Euro/km2.

For operational crop monitoring please contact us.

EOatDHI part of the DHI GROUP

gras@dhigroup.com
+45 4516 9100

Agern Alle 5,
2970 Hørsholm,
Denmark

CVR: 36466871

Water Quality

Satellite data analysis

Why is it important?

Having access to near real-time information about the conditions of water quality and its distribution is essential to proactively manage risks and improve responses to water incidents, such as algal blooms, red tides or sediment plumes.

Remote-sensing is the only practical and economical method to detect the quality of marine environments as well as remote and large inland waters where frequent in situ sampling is impossible. Satellite-image archives enable change detection of previously unmeasured or un-monitored water bodies.

How does it work?

At DHI GRAS we process satellite imagery with state-of-the-art algorithms to produce accurate and seamless maps on water quality, such as chlorophyll concentrations or suspended matter content.

These maps enable assessments of the current and historic state of the water quality and its variability in space and time, which is key for impact assessments, early warnings, environmental monitoring as well as water resource management.

What you get!

Detailed and customised mapping of the water quality in your water environment with very fast turn-around time

Insights into historical water quality conditions and comparison with present information

Seamless integration of information from Earth Observation and in situ monitoring into your decision support system

Typical customers?

Contractors to survey the impact of construction work in marine environments

Authorities to complement or redesign traditional water quality monitoring for their monitoring obligations, e.g. for the Water Framework Directive or support early warnings of occurrences of algae blooms, red tides and sediment plumes

Aquaculture farmers to monitor water condition and its variability in space and time or support site selection decisions

Specifications

Depending on the aim of the monitoring and the desired spatial resolution, the temporal frequency ranges from daily to annual and the spatial resolution from 10-300 meters

All data can be aggregated according to customer specifications, such as seasonal means, monthly means etc.

In general, satellites provide information on the uppermost layer of the water body

Please contact us for more information

Price list

Contact us for a quote

EOatDHI part of the DHI GROUP

gras@dhigroup.com
+45 4516 9100

Agern Alle 5,
2970 Hørsholm,
Denmark

CVR: 36466871

Satellite Imagery

Satellite data analysis imagery images

Why is it important?

Satellite imagery is a highly valuable source of information as the applications are many and can be tailored to the individual project.

Traditional field surveys to monitor areas and projects are costly and time-consuming, whereas this solution gives you the information you need at a similar price but much faster.

With satellite imagery you can track the local environment, the progress of your infrastructure project or urban developments. It also allows for comparison with archived data and depicts large and remote areas.

How does it work?

DHI GRAS is working together with the world’s leading providers of satellite imagery to increase the access to the continuously growing field of satellite data.

Due to the recent improvements in spatial resolution, satellites are now a competitive alternative to aerial photography and field visits in many different applications. An array of different satellites ensures your specific needs will be covered.

Our vast experience allows us to offer our customers an independent and solid advice on which satellite image that would fit the specific purposes best.

Through our distribution agreements with almost all commercial satellite operators we make sure the latest news and details are available to our customers.

What you get!

A product that fits into all types of GIS applications and other software packages

Access to independent and experienced advice on which satellite imagery fits your project the best

Access to a large portfolio (+50) of radar imagery with all-weather image capabilities

Typical customers?

Municipalities looking for a cost-efficient overview of their area

Researchers looking for detailed imagery for research purposes

Planners looking for detailed insights for remote sites before field surveying and construction activities

Specifications

WorldView-2: multispectral imagery at 1.8 meter resolution and panchromatic imagery at 0.46 meters

QuickBird: 60 cm resolution (panchromatic and pansharpened) and 2.4 m multispectral

GeoEye-1: 0.4 m resolution (panchromatic and pansharpened)

Ikonos: 4 m multispectral

RapidEye: 5 m

Pleiades: 4 band data at 2 m resolution and panchromatic data at 0.7 m

Price list

Get archived optical data products from €10/km² with a spatial resolution from 0.5 m

Get new optical data acquisition from €17/km² with a spatial resolution from 0.5 m

EOatDHI part of the DHI GROUP

gras@dhigroup.com
+45 4516 9100

Agern Alle 5,
2970 Hørsholm,
Denmark

CVR: 36466871

Satellite-derived Bathymetry

Why is it important?

Coastal environments are some of the most dynamic and constantly changing regions of the globe. Monitoring and mapping these changes is critical to environmental studies and construction activities such as harbours, pipelines and other critical infrastructure in the coastal zone and shallow off-shore areas.

A significant part of the worlds coastal region is still poorly mapped, or the mapping is significantly outdated. Navigating in poorly mapped or dynamic areas can be supported with up-to-date satellite-derived water depths. The quick turnaround allows for quick delivery of up-to-date information as support to time-critical situations such as disaster relief following natural disasters where existing map material may have become outdated.

How does it work?

At DHI GRAS, we have developed a cost-effective method for accurate water depth mapping based on high resolution satellite images. Based on over 10 years of research and project activities we have developed an approach that exploits all the newest satellite systems.

Our proprietary state-of-the-art physical modelling method secures highly accurate deliveries. The approach is globally applicable, and we have helped clients all over the world from the polar regions to the tropics.

Satellite-derived bathymetry is a cost-effective approach to detailed mapping of the worlds shallow areas. Unlike field-based surveys the solution has a quick turnaround, no health and safety issues and requires no permits.

Since it is based on satellite information it is also ideal for remote areas and harsh environments.

What you get!

Very detailed mapping of the coastal and nearshore area in 2 to 10 meter spatial resolution 

Very fast turn-around time no matter the location

Our proprietary methods and rigorous quality assessment ensures high quality data deliveries

Senior Project Manager,
Niras

Klavs Bundgaard

NIRAS has used high resolution bathymetry data from DHI GRAS for a detailed wave and water level study in Denmark. The bathymetry data was derived from satellites in an impressive high resolution. With the surface coverage, it was possible to see detailed morphological variations such as longshore bars, sand waves and other similar features, which are not normally seen in traditional measurements with that level of detail. It clearly made the subsequent modelling much more valid. The product is price-wise very competitive compared to traditional survey methods.

Typical customers?

Widely used by the modelling community where accurate bathymetry is required for any high quality hydrodynamic modeling of the coastal zone

Engineering companies working in the coastal zone use our data in the initial planning phase and as a first screening before conducting costly field campaigns

National authorities and hydrographic offices get up-to-date information about territorial waters and minimize navigational hazards within their area of responsibility

Specifications

We are industry leading providers of satellite-derived bathymetry

Our solution is based on more than 10 years of research and development funded by European Commission, European Space Agency, national authorities and internal funds

We have a proven track record with satisfied clients all over the world

We have a fast turn-around on all deliveries

We offer a cost efficient and industry leading high-quality product

Globally applicable where conditions allow it

All data undergo a very thorough quality

Every data point comes with an associated derived uncertainty measure

Price list

Available resolutions:

2-m resolution

10-m resolution

Price range depends on size of Area of Interest

Contact us for details and custom quotes

Visit us at our bathymetry data portal

EOatDHI part of the DHI GROUP

gras@dhigroup.com
+45 4516 9100

Agern Alle 5,
2970 Hørsholm,
Denmark

CVR: 36466871

Urban Mapping

Why is it important?

Urbanisation and growing commercial and residential development has substantially increased the proportion of impervious areas. Unlike areas with natural water percolation, impervious surface areas do not allow runoff to seep into the ground.

These impervious surface areas therefore have a large impact on storm water runoff – an impact which will be even further exacerbated in the future, where more extreme rainfall events are expected due to ongoing climatic changes.

In order to mitigate the potential threats from extreme weather events and promote sustainable urban planning, decision-makers and practitioners will need to know where all the excess water goes.

Spatially explicit information about the amount, location and type of impervious surfaces helps to evaluate how storm water runoff will be affected by future climatic changes as well as urban development.

How does it work?

The maps depict spatial explicit information about the amount, extent, location and type of impervious surface using advanced image analysis of satellite imagery or aerial photos.

With this approach an overview of the survey area can be given at a specific point in time and can differentiate between various types of impervious surface roads (e.g. roads, rooftops, parking lots) and pervious areas (e.g. parks, lakes, streams).

Our highly automated impervious surface solution is designed to provide professionals with the ideal reference information for hydrological modelling and urban planning.

What you get!

Updated and detailed maps of impervious surface areas in several thematic classes

Consistent and objective mapping, easily facilitating future updated maps

Delivery of the input satellite image in GIS format

Typical customers?

Urban planners use the maps to locate areas that may benefit from urban green planning or water infrastructure investments

Hydrological modelers use maps of impervious surface areas as key input for modelling of urban storm water runoff

Public decisionmakers use the maps to monitor the overall green status of the urban areas

Specifications

The thematic maps cover classes such as impervious areas, roads, buildings, vegetation and water

Data is ready for use in hydrological modelling software or Geographic Information Systems (GIS)

Mapping can be done based on existing aerial photos or on satellite imagery down to 30 cm spatial resolution

For river basin mapping, it is possible to perform the mapping at smaller map scales, using medium resolution satellite images

Price list

Prices starting at 75 EUR/sqkm

The price of Impervious Surface Mapping varies and relates to factors such as size of the area, input data types and availability of ancillary data

Contact us for a custom quote

EOatDHI part of the DHI GROUP

gras@dhigroup.com
+45 4516 9100

Agern Alle 5,
2970 Hørsholm,
Denmark

CVR: 36466871

Land Cover

Why is it important?

Land cover mapping represent perhaps the most common and useful applications of satellite remote sensing.

Land cover mapping is used within a wide range of applications including natural resource management, urban planning, hydrological modeling and exploration of oil, gas, and minerals.

The access to historical data makes it possible to detect land cover and land cover changes back in time, and the continued supply of new image data allows monitoring and detection of changes in land cover in the observed period of time. Up-to-date land cover maps and change detection maps are often used in environmental impact assessments.

How does it work?

A satellite image contains information that can readily be analyzed and interpreted visually.

Nevertheless, it is in some cases necessary to convert the satellite image to a thematic map of different land cover or land use types.

This will make it possible to work quantitatively with the characteristics of the area to analyse and understand the land cover and surface better.

A land cover representation allows to perform calculations on i.e. the area of each class or analyze distances to roads or settlements. Comparing historical assessments of land cover with recent land cover allows for investigating landscape changes.

Land cover and land cover change maps are often used as inputs to hydrological models or for environmental impact assessments.

What you get!

An up-to-date graphical representation of the surface

A systematic assessment of land cover with custom tailored classes

Various resolution and accuracies are possible depending on needs

Typical customers?

Hydrologists use land cover as input to regional hydrological models, soil erosion models or flood models

Environmental managers use land cover as background for other thematic layers (e.g. administrative units, location of towns, environmental sensitive areas etc.) as part of Environmental Impact Assessments

Agronomists/forest managers use landcover to understand and update agricultural statistics on i.e. crop types, fallow periods, deforestation, and forest regrowth

Specifications

The basic principle behind land cover mapping is the ability to distinguish different surface covers based on their spectral signatures

Typical land cover classes we map are: vegetation, built-up area, water bodies, agricultural areas and forest areas

The actual classes to be mapped depends on the usage of the land cover maps

Our approach is to customize the land cover maps with regards to budget, actual classes and detail level

Price list

Typically land cover maps are produced in 10-30 m resolution with approximately 10 different classes, but can be produced in much finer details down to 30 cm resolution

The cost for land cover maps typically starts at a few thousand euros, but actual price depends on detail level and actual land cover classes

Contact us for a specific quote

EOatDHI part of the DHI GROUP

gras@dhigroup.com
+45 4516 9100

Agern Alle 5,
2970 Hørsholm,
Denmark

CVR: 36466871

Suspended Sediment

Why is it important?

Monitoring sediment load and distribution during dredging and material handling in aquatic environments is important for infrastructure companies and environmental authorities to ensure that the health of these coastal systems is not disturbed.

By utilizing the opportunities that satellites provide, it is possible to optimize the timing of field campaigns so that any and all seasonal variations are included in the sampling based on historical data, and at the same time get more accurate and cost-efficient information than traditional monitoring techniques. This reduces the risk of dredging bans and limits damage from dredging.

How does it work?

Sediment detection from satellite information reduces the risk and damage of dredging while providing more accurate and cost-efficient information than traditional monitoring techniques.

Many infrastructure companies and environmental authorities face difficult circumstances when undertaking coastal constructions, dredging activities and general management of coastal activities.

Traditional monitoring methods include costly field based approaches with associated risks for both personnel and equipment.

We can provide you with a web-based solution that provides information on the spatial distribution, in near real-time, which optimizes construction and production activities and reduces costs.

What you get!

A quick and cost-efficient way of monitoring suspended sediment in your coastal area

A baseline to establish the spatial extent of sediment distribution and load

A tool to separate the effect of marine construction from natural occurrences

Typical customers?

Coastal managers use it for identification of potential sedimentation problems, for environmental impact assessments, and for monitoring conditions during coastal constructions

Coastal construction companies use it to document the environmental impact, for optimal site identification and to identify baseline conditions

Dredging companies use it to estimate sediment movements. To document environmental impact of activities and to calibrate sediment movement models

Specifications

This type of information can be delivered in near real time for regional studies (250 m – 1200 m resolution) and within a few days for detailed studies (0.6 m – 30 m resolution)

Historical analysis possible based on archived satellite data to establish baselines

Cost-effective compared to traditional monitoring methods (in-situ collection, buoy measurements etc.)

Provides information on spatial variation – not just a point measurement

Data available in a ready to use format – easy incorporation into existing GIS systems and databases

Price list

Contact us for a quote

EOatDHI part of the DHI GROUP

gras@dhigroup.com
+45 4516 9100

Agern Alle 5,
2970 Hørsholm,
Denmark

CVR: 36466871