Determining the extent of satellite data from Sentinel 1 and 2 for automating the categorization and quality assurance of mapped lakes in the GeoDanmark dataset . . . .
Sentinel-based change detection for GeoDenmark
Determining the extent of satellite data from Sentinel 1 and 2 for automating the categorization and quality assurance of mapped lakes in the GeoDanmark dataset
Why is it important?
The results of this study provides the basis for using satellite data sources and Machine Learning methods for a nationwide automated classification and quality assurance of topographic maps in the GeoDanmark dataset.
A further development of the methods could make a nationwide screening of all lakes in Denmark possible.
Project highlights:
Using Sentinel time series and Machine Learning to validate lakes in existing topographic maps
Providing quality managers with a cost-effective tool to prioritise efforts with quality assurance of existing and future data sets
Showing the possibility of a nationwide screening of all lakes in Denmark in the future
In more detail..
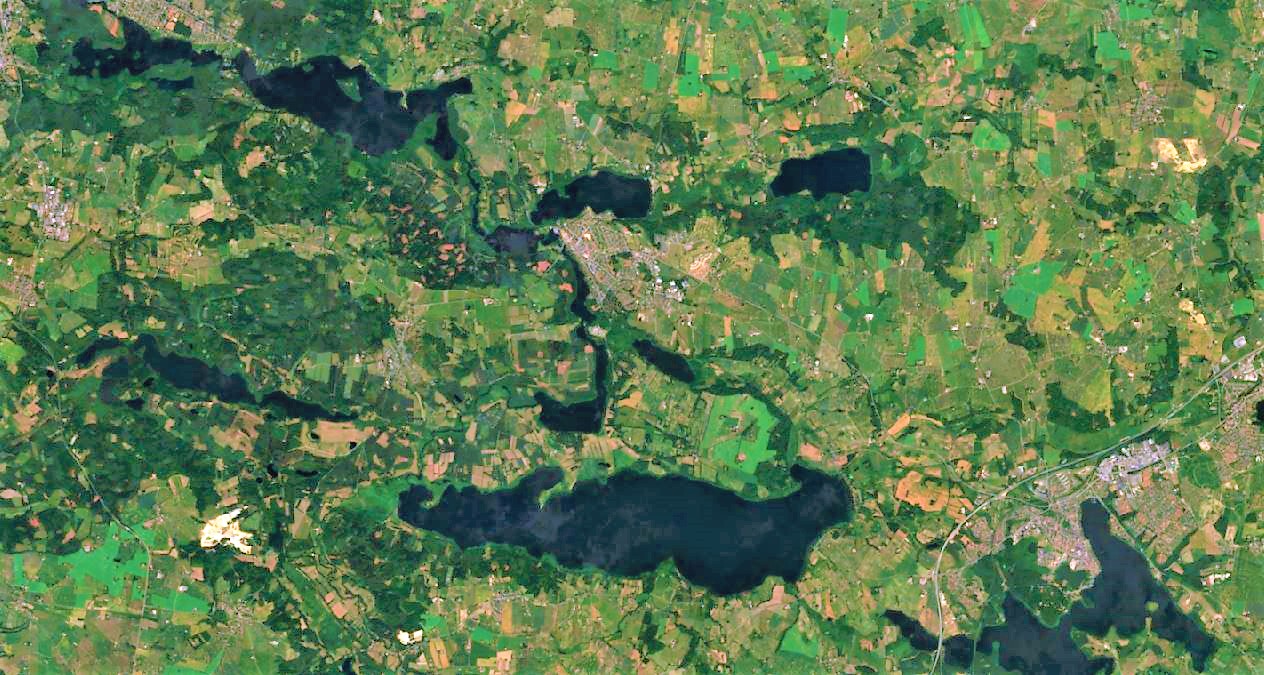
A study area covering parts of Northern Jutland was analysed using relevant Sentinel 1 and 2 satellite imagery from 2017.
The temporal resolution of Sentinel-1 is high, and it therefore has the advantage of providing large amounts of data throughout the year. However, it is limited in its spatial resolution which makes the classification of relatively small objects difficult e.g. small lakes, since they do not show on the images.
Sentinel-2, on the other hand, has the advantage of having a significantly better spatial resolution, which enables the classification of small lakes. Here, the limitation is that clouds and shadows limit the temporal resolution.
Combining data from the two satellites, would therefore give a better data coverage.
We found that a relatively large portion of the mapped lakes in the GeoDenmark dataset, from a Sentinel-based point of view, either cannot be described as lakes or may be deviating from the existing categories.
The results of this study indicates that there are good prospects in using the Sentinel-based data sources and methods for a nationwide automated classification and quality assurance of topographical maps, such as the mapped lakes in the GeoDenmark data set.
In this study, we focused on previously mapped lakes in the GeoDenmark data set, but it is expected that the same method could be used to map lakes that do not already exist in the dataset.
Based on a limited further investigation of the methods used, it is estimated that a nationwide screening of all lakes in Denmark, approx. 180.000 in total, could be automatically categorized and figure in the GeoDenmark dataset for lakes.
The Danish Agency for Data Supply and Efficiency:
The agency provides the public and private sector with high-quality data, enabling them to make important community decisions based on the best available information.
The agency is part of the Energy, Supply and Climate Ministry in Denmark.
Monitoring chlorophyll and submerged aquatic vegetation in Danish coastal waters with remote sensing technologies . . . .
ReSTEK - Remote sensing technologies for coastal monitoring
Monitoring chlorophyll and submerged aquatic vegetation in Danish coastal waters with remote sensing technologies
Why is it important?
Remote sensing technology can provide systematic and cost-effective information of the marine and coastal environment at large scales.
This is of interest to public authorities, looking to further increase the effectiveness of national monitoring programs through the inclusion of novel technology.
Project highlights:
Assessing the potential use of air and spaceborne remote sensing technologies for monitoring submerged aquatic vegetation in the nearshore coastal zone of Danish waters
Mapping the distribution of benthic habitats to expand the knowledge about e.g. eelgrass area coverage as an indicator for water quality status
Evaluating the use of Sentinel 2 and 3 satellites for monitoring surface chlorophyll concentration to improve the temporal resolution and the spatial distribution of the current water quality monitoring program
In more detail..
The Danish Environmental Protection Agency initiated a 2-year activity in 2017, where DHI GRAS was in charge of satellite analyses of water quality and benthic habitat mapping for selected Danish water areas.
We examined the potential for using remote sensing technologies in connection with the current Danish national NOVANA (National Monitoring and Assessment Programme for the Aquatic and Terrestrial Environment) monitoring program.
The first part of the project looked at the distribution of eelgrass using data from the Sentinel-2 satellites. Eelgrass is an important water quality indicator and has been included in the Danish water plans to assess the environmental state along the Danish coasts. The eelgrass distribution reflects the clarity of water and nutrient richness and thereby indirectly the quality of the water.
The most common practice for mapping eelgrass meadows is to record the distribution along a transect line with a diver, which is costly and unsuitable to derive the complete temporal and spatial eelgrass cover of the Danish coastal waters.
An updated nationwide map of the eelgrass distribution therefore has several potential uses in the Danish water plans:
1) For further development of eelgrass as an indicator of the coastal areas' condition
2) In connection with land-use planning and concrete protection of eelgrass meadows
3) For quantification of eelgrass's ecosystem services
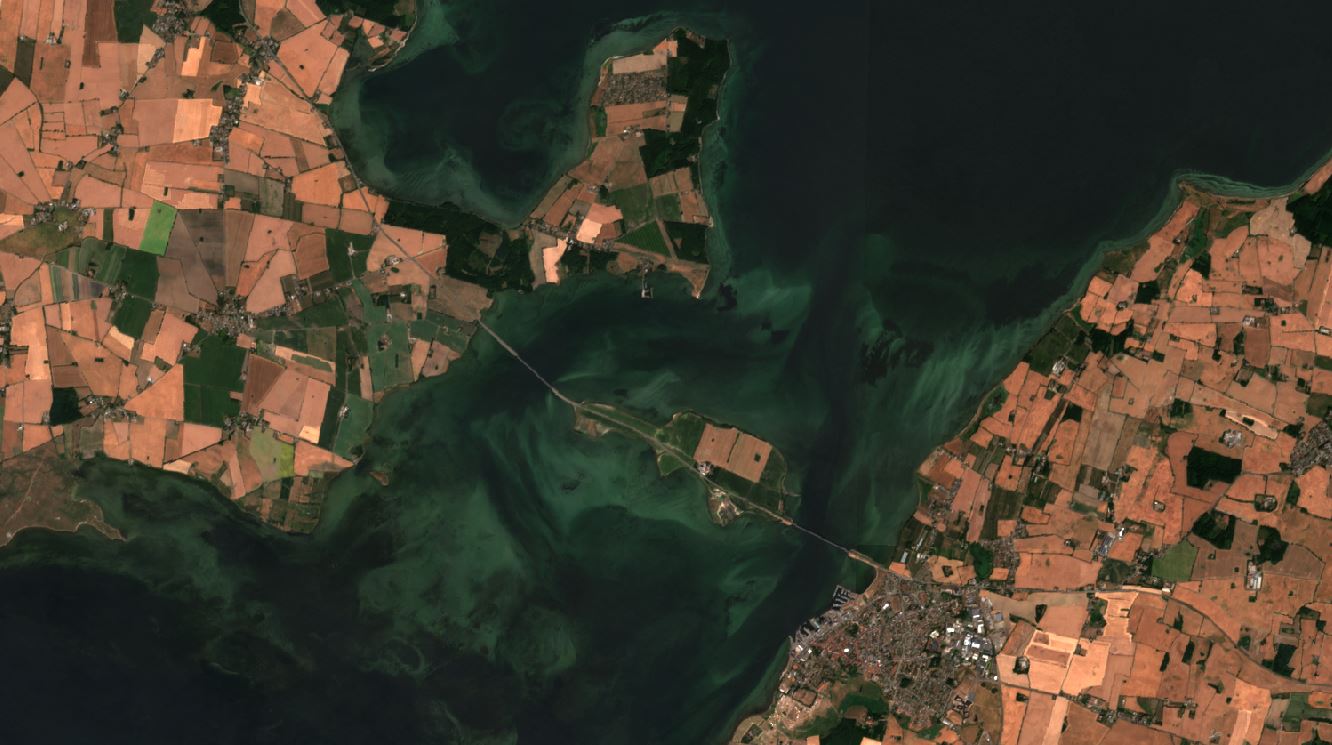
The second part of the project looked at the chlorophyll concentrations in the Danish surface waters using data from Sentinel-2 and Sentinel-3 satellites.
Chlorophyll concentrations are regularly determined by a chemical analysis of water samples which are collected from a ship and subsequently undergone trial processing in the laboratory. Because this type of traditional sampling is costly, usually measurements are taken at only 1 location per water area, approximately every 14 days.
This limits the ability to document the spread and temporal dynamics of important events such as algae blooms and leads to relatively large deviations in seasonal means.
The combination of Sentinel-2 and Sentinel-3 provided a cost-effective way to supplement national in-situ monitoring of surface chlorophyll in the shallow Danish coastal waters, in order to improve the temporal and spatial distribution of chlorophyll concentration.
Satellite technology cannot replace in-situ sampling completely, but it can optimise sampling design and fill gaps.
By bringing together information from various sources, the confidence in the data can be enhanced and greatly improve national assessments.
Chlorophyll summer mean 2018 from Sentinel-3 for Roskilde Fjord and Isefjord.
The Danish Environmental Protection Agency:
EPA is the authority in charge of preparing legislation, granting authorisations and providing guidelines within the fields of the environment and health: chemicals, pesticides, gene technology, soil, waste and environmental technology.
The range of tasks is broad, from algae bloom detection and regulations for chemicals in hair colourants, through investigations into how more waste can be recycled and authorisations for new pesticides to the handling of fruit and vegetables.
Using remote sensing to map and characterize the coastal zone within the planned oil spill sensitivity atlas . . . .
Mapping the coastal zone in NE Greenland
Using remote sensing to map and characterize the coastal zone within the planned oil spill sensitivity atlas
Why is it important?
Remote and challenging regions, such as Northeast Greenland, are difficult to map in detail, and existing topographic maps in Greenland are usually inaccurate with undefined or undocumented features and characteristics.
This makes it difficult to create an Environmental Oil Spill Sensitivity Atlas for NE Greenland, which already exists for West and South Greenland. Such atlases require a topographic base map and information on the physical environment.
With freely and commercially available satellite imagery as well as advanced image analysis coupled with local knowledge it is possible to provide detailed characteristics of the coastal zone in the arctic waters without the safety risks associated with traditional survey methods and at a much more cost-efficient rate, resulting in reliable and objective data.
Project highlights:
Geological and morphological classification of the coastline in NE Greenland aiming to be included in an oil spill sensitivity atlas providing the foundation for a planning tool for when an emergency response is needed
Determining the intertidal zone in the area and calculating depth of shallow waters
All derived products made publicly available through a governmental spatial infrastructure platform
In more detail..
The project used remote sensing approaches to map and characterize the coastal zone within the planned oil spill sensitivity atlas which includes off-shore hydrocarbon areas of interest in NE Greenland.
Using new methods within satellite remote sensing data gives the possibility of providing updated products at a higher resolution in a timely manner.
This work will be highly complementary to the coarser scale but larger regional coverage of the planned atlas, which will be based on existing data. Both products will act as a validation tool for the other, and will also allow for the opportunity to examine advantages and limitations of the different approaches.
The demonstration mapping products have all been based on satellite information that would facilitate an upscaling of the mapping allowing to cover large and poorly mapped regions of the Arctic.
An important part of the existing oil spill sensitivity atlases is the analysis of the oil spill resistance of the coast. General coastal morphology and geology determines how oil spills will be absorbed by the materials along the coast or washed off. This is traditionally done by a manual assessment using available topographic maps and low resolution satellite images in segments of a few kilometers along the coast.
The new analyses would be beneficial to the atlas as it can detect straight or complex coastlines for the identification of risk of possible oil concentrations caught in pocket beaches or other complex morphologies. It can also determine geology types indicating where the oil would be absorbed or rejected and the new information about tidal zones would indicate where oil would be saturated.
The project has been conducted collaboratively with a team of experts from our partners Asiaq, GINR and DCE.
Exploring service provision opportunities and evaluating payload maturity for HAPS platforms . . . .
Combining satellites with High Altitude Pseudo Satellites (HAPS)
Exploring service opportunities and evaluating payload maturity for HAPS platforms
Why is it important?
As a future technology, HAPS platforms will open a new market for remote sensing and surveillance. It offers disruptive and complementary applications to services enabled by satellites, terrestrial infrastructures and Remotely Piloted Aircraft Systems (RPAS), at relatively low cost.
Project highlights:
Providing detailed analysis of existing technology gaps and service limitations for maritime activities.
Identification of system and performance requirements to explore payload components and infrastructure conforming to the requirements of the target user community
Extensive review of earth observation sensors to define a payload package consistent with user and platform specific requirements
In more detail..
Still in the early stage of development, production and operation, High Altitude Pseudo Satellites (HAPS) offers the potential to open a new market for remote sensing and surveillance in the future. HAPS operates at an altitude of approximately 20 km and can observe locations over extended time periods. This enables time critical and continuous monitoring and surveillance over specific areas of interest at relatively low cost.
In the ESA funded project ‘services enabled by HAPS complemented by satellites’, DHI GRAS explores the feasibility and capability of HAPS enabled services to extend the capabilities of satellites and Remotely Piloted Aircraft Systems (RPAS) in the domain of Earth Observation. The main objective is to propose potential services for HAPS that exploit the characteristics of the individual platforms and evaluate the maturity of payload technologies necessary to facilitate service provision.
Through an extensive stakeholder engagement process with potential end-users of HAPS enabled services within maritime operations and surveillance, we established a baseline for a system service definition and payload configuration that addresses the primary technology gaps and service limitations within target user communities. Through this analysis the client gained critical insight into the potential uptake and viability of services enabled by HAPS platforms.
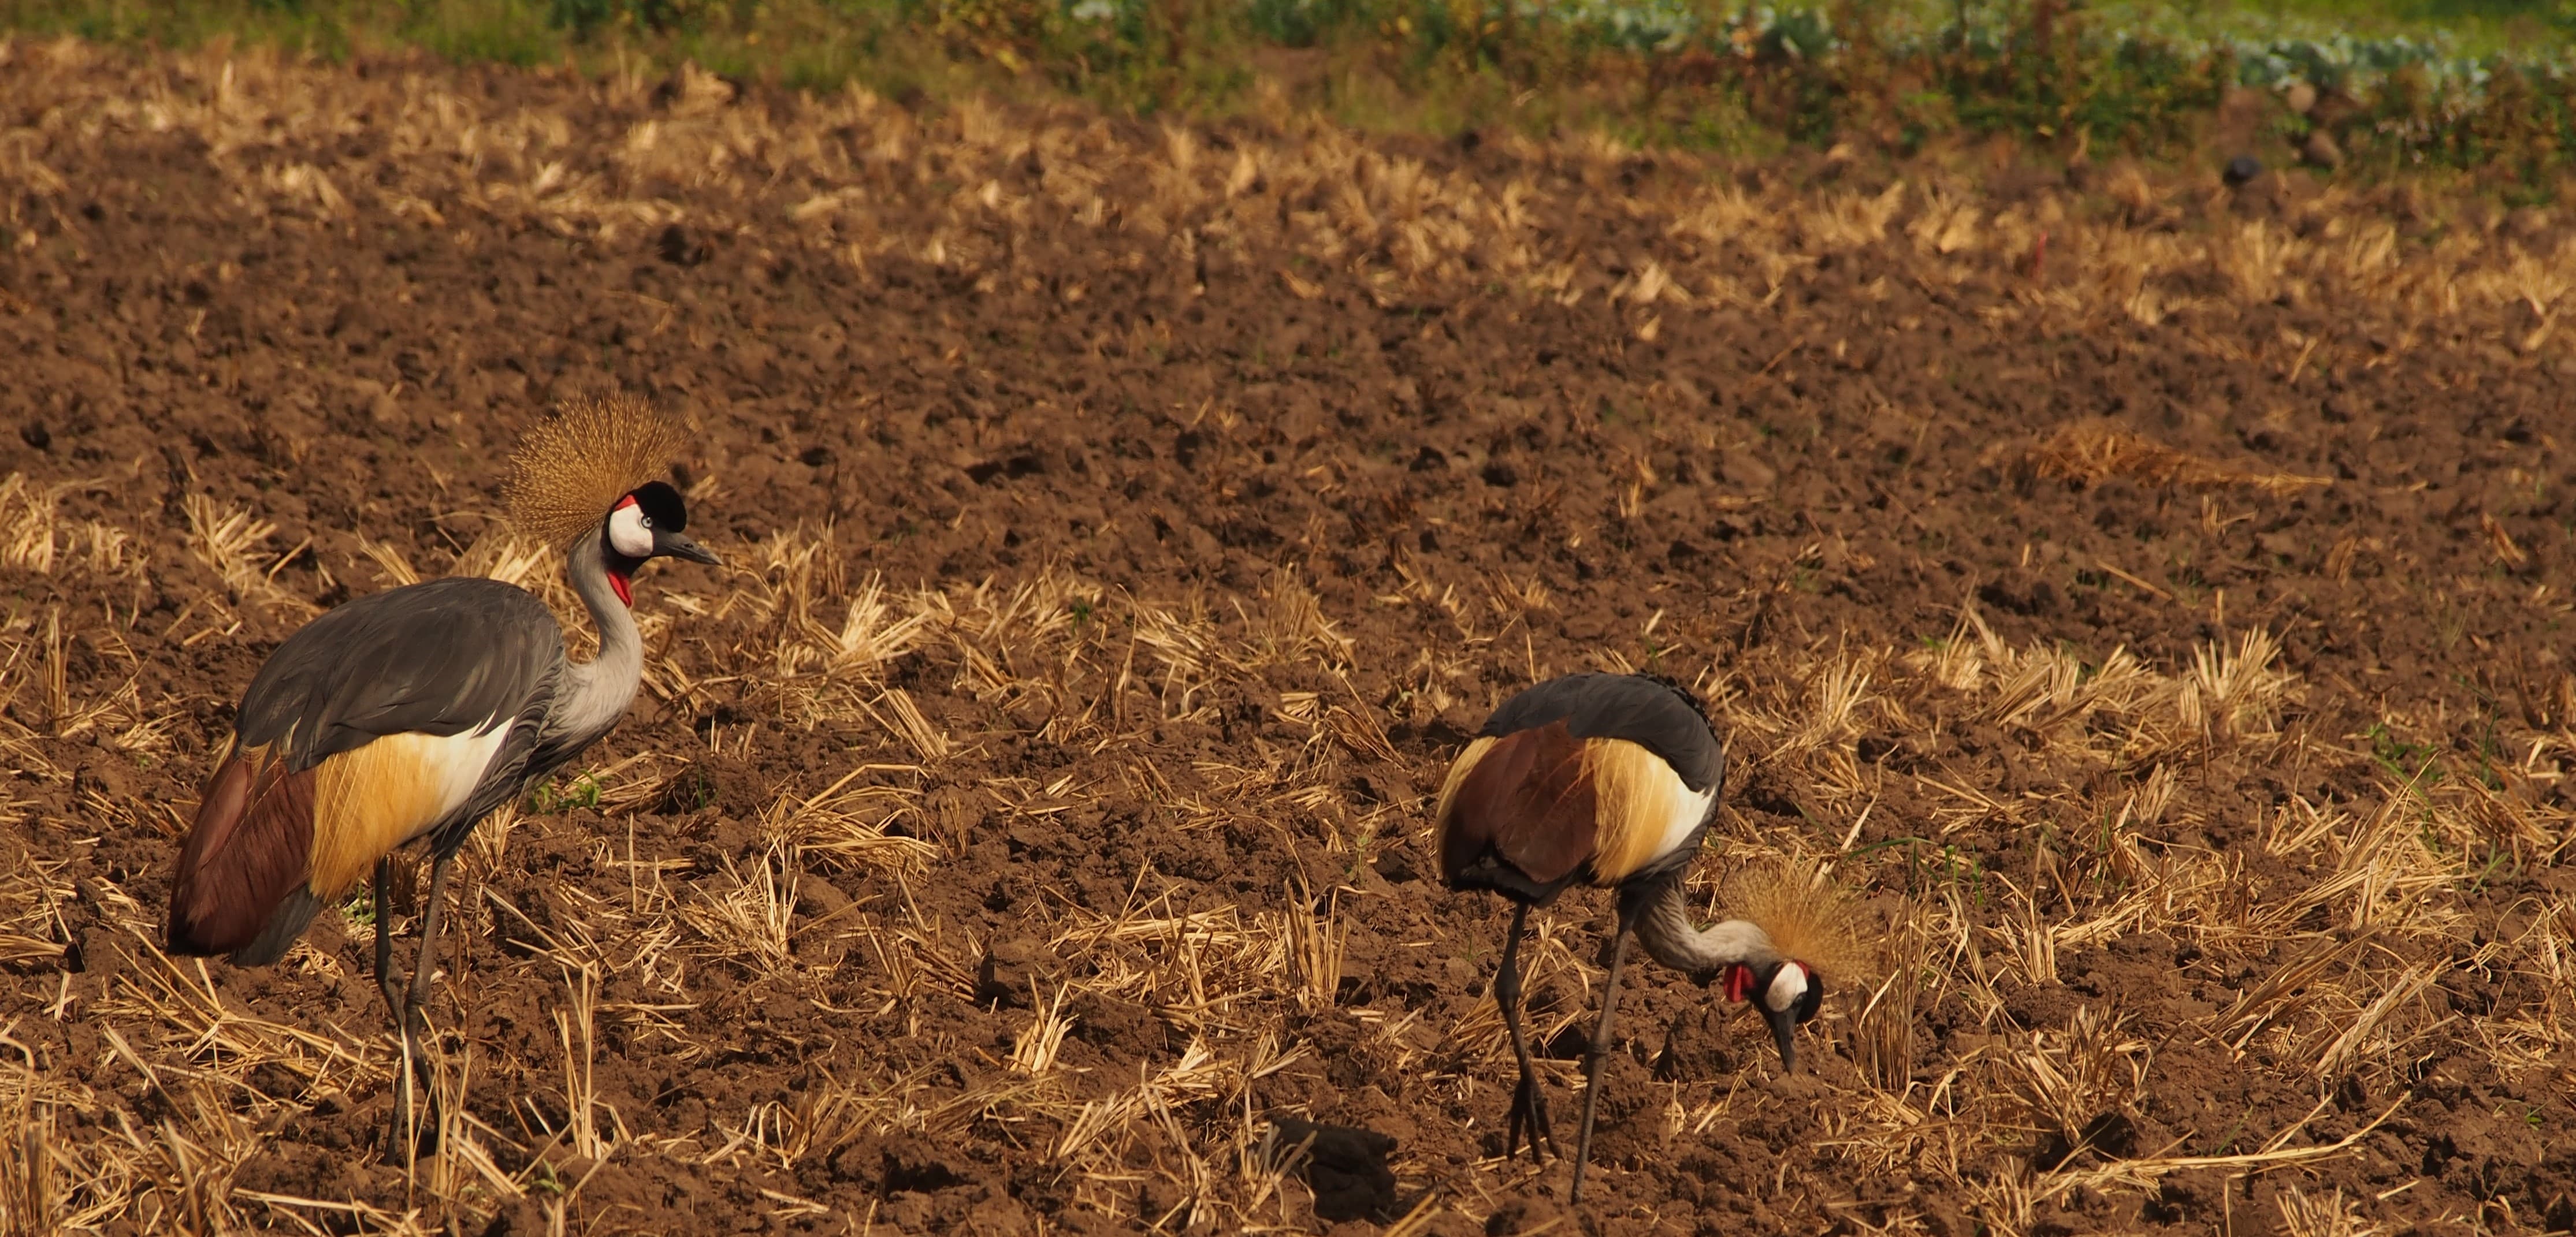
AI4WATER - National Geographic Society and Microsoft Grant
Satellite-based evapotranspiration for improved crop water efficiency in Uganda.
Why is it important?
In Uganda, irrigation development contributes to food security, poverty alleviation and economic growth by using water sustainably.
Satellite remote sensing of evapotranspiration (ET) is an essential part of global observation systems. It provides inputs for agriculture, water resources management, weather forecasts, climate studies and many other applications. Easy access to reliable estimations of ET is a key requirement within these domains. When ET is successfully estimated at high resolution it can map crop water stress at field scale.
Project highlights:
Developing and implementing an open-source AI algorithm that merges optical, thermal and meteorological data.
The ability to get information on water stress levels for farms in Uganda. Due to the resolution, we can provide evapotranspiration information at farm level
Better insights can lead to 30% less water use for the same yield.
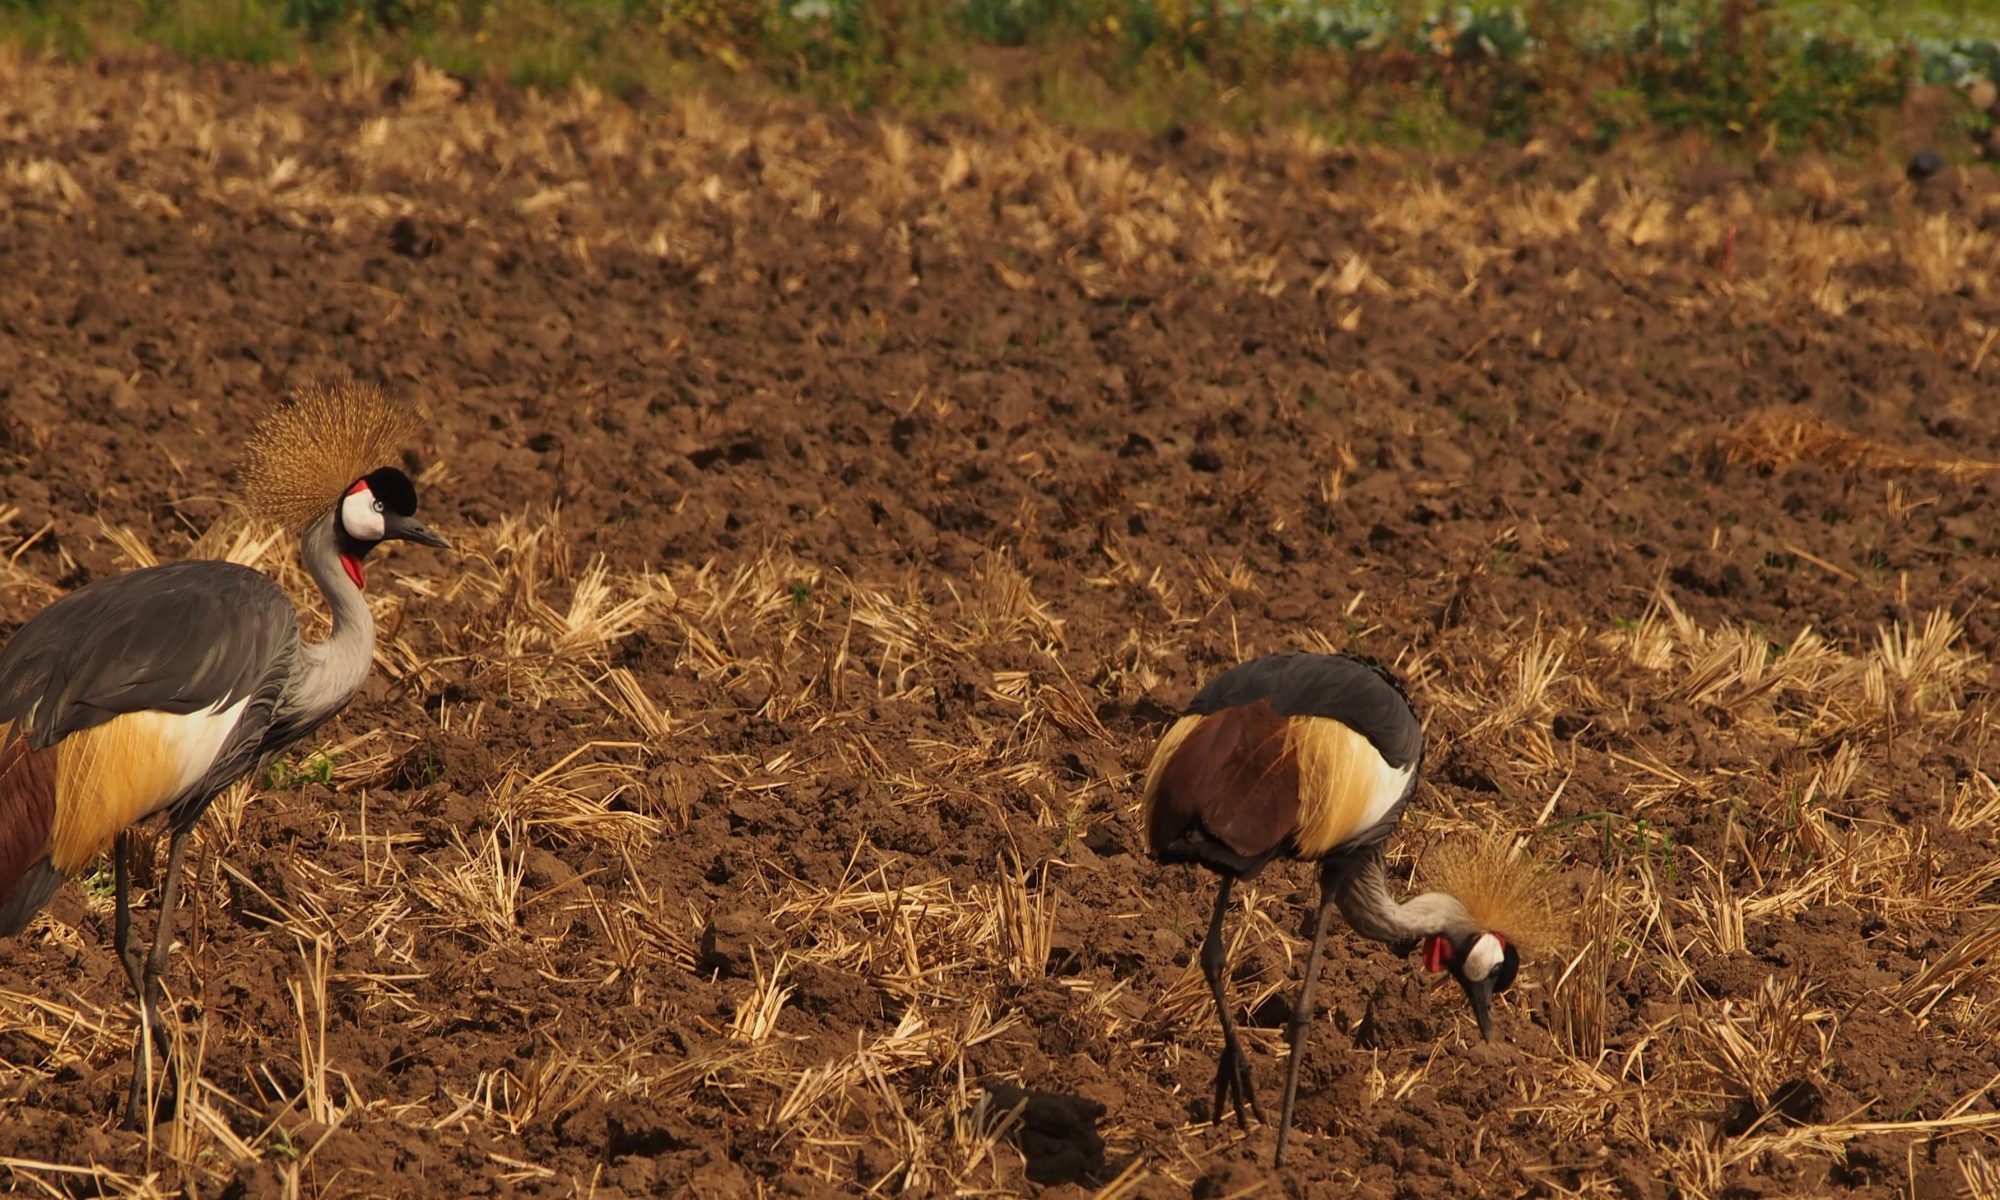
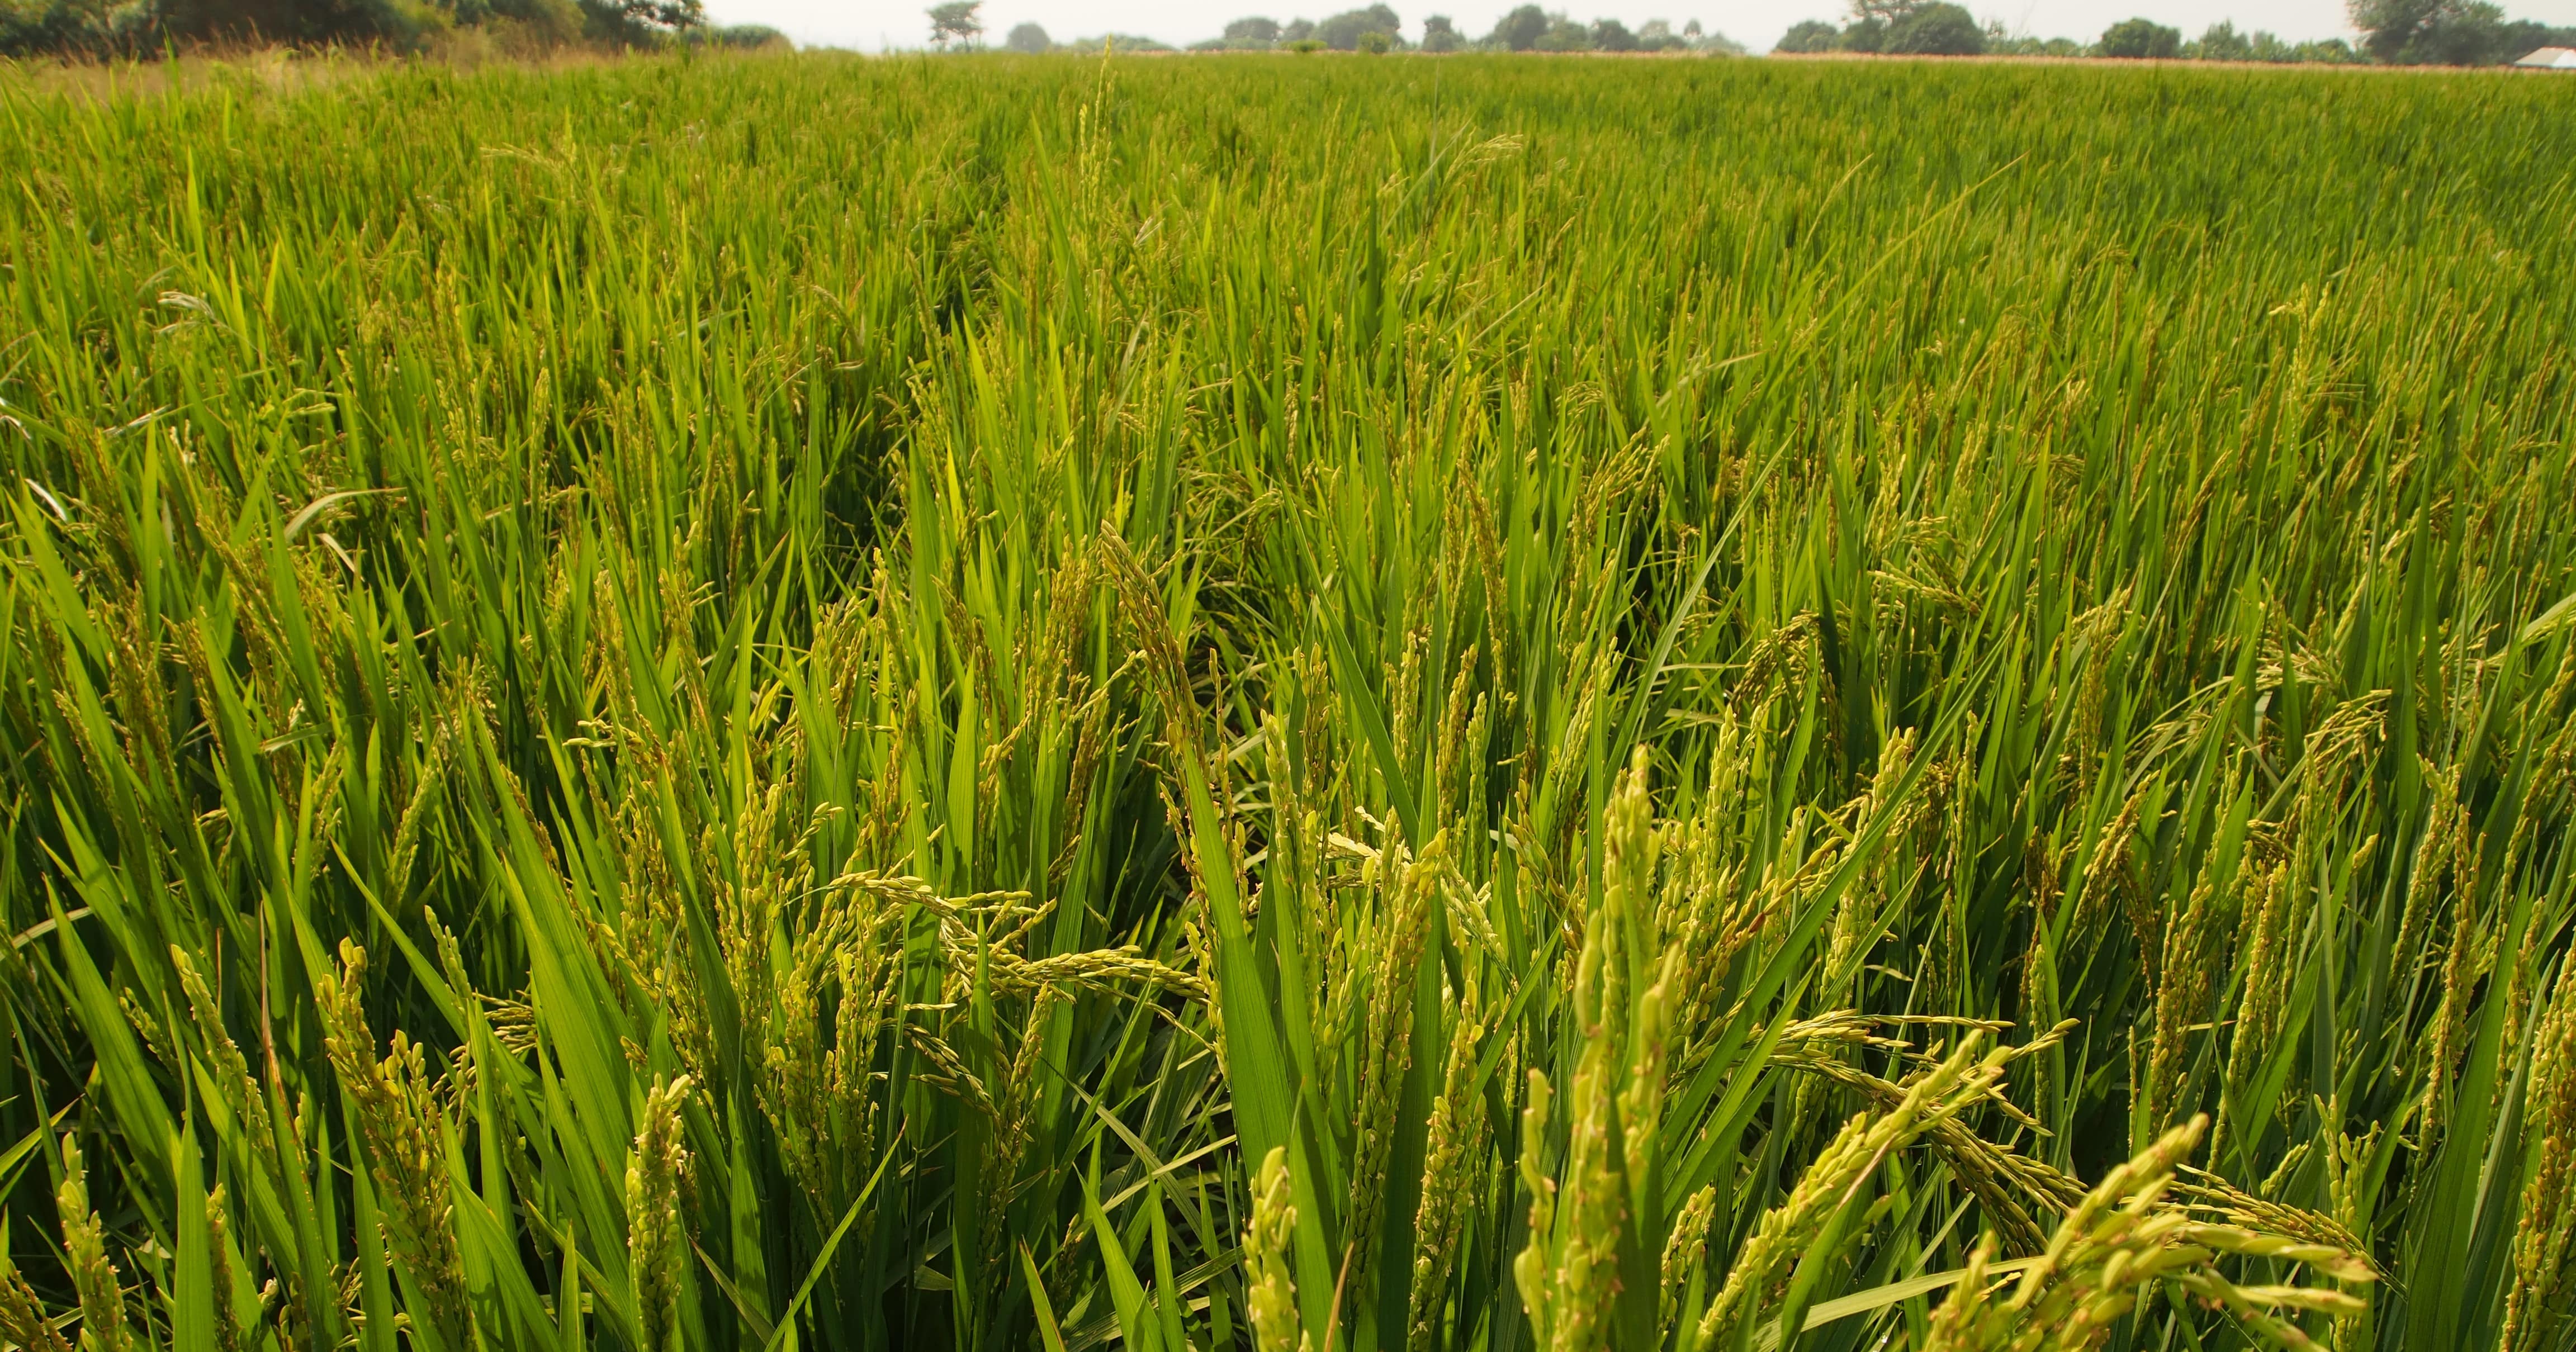
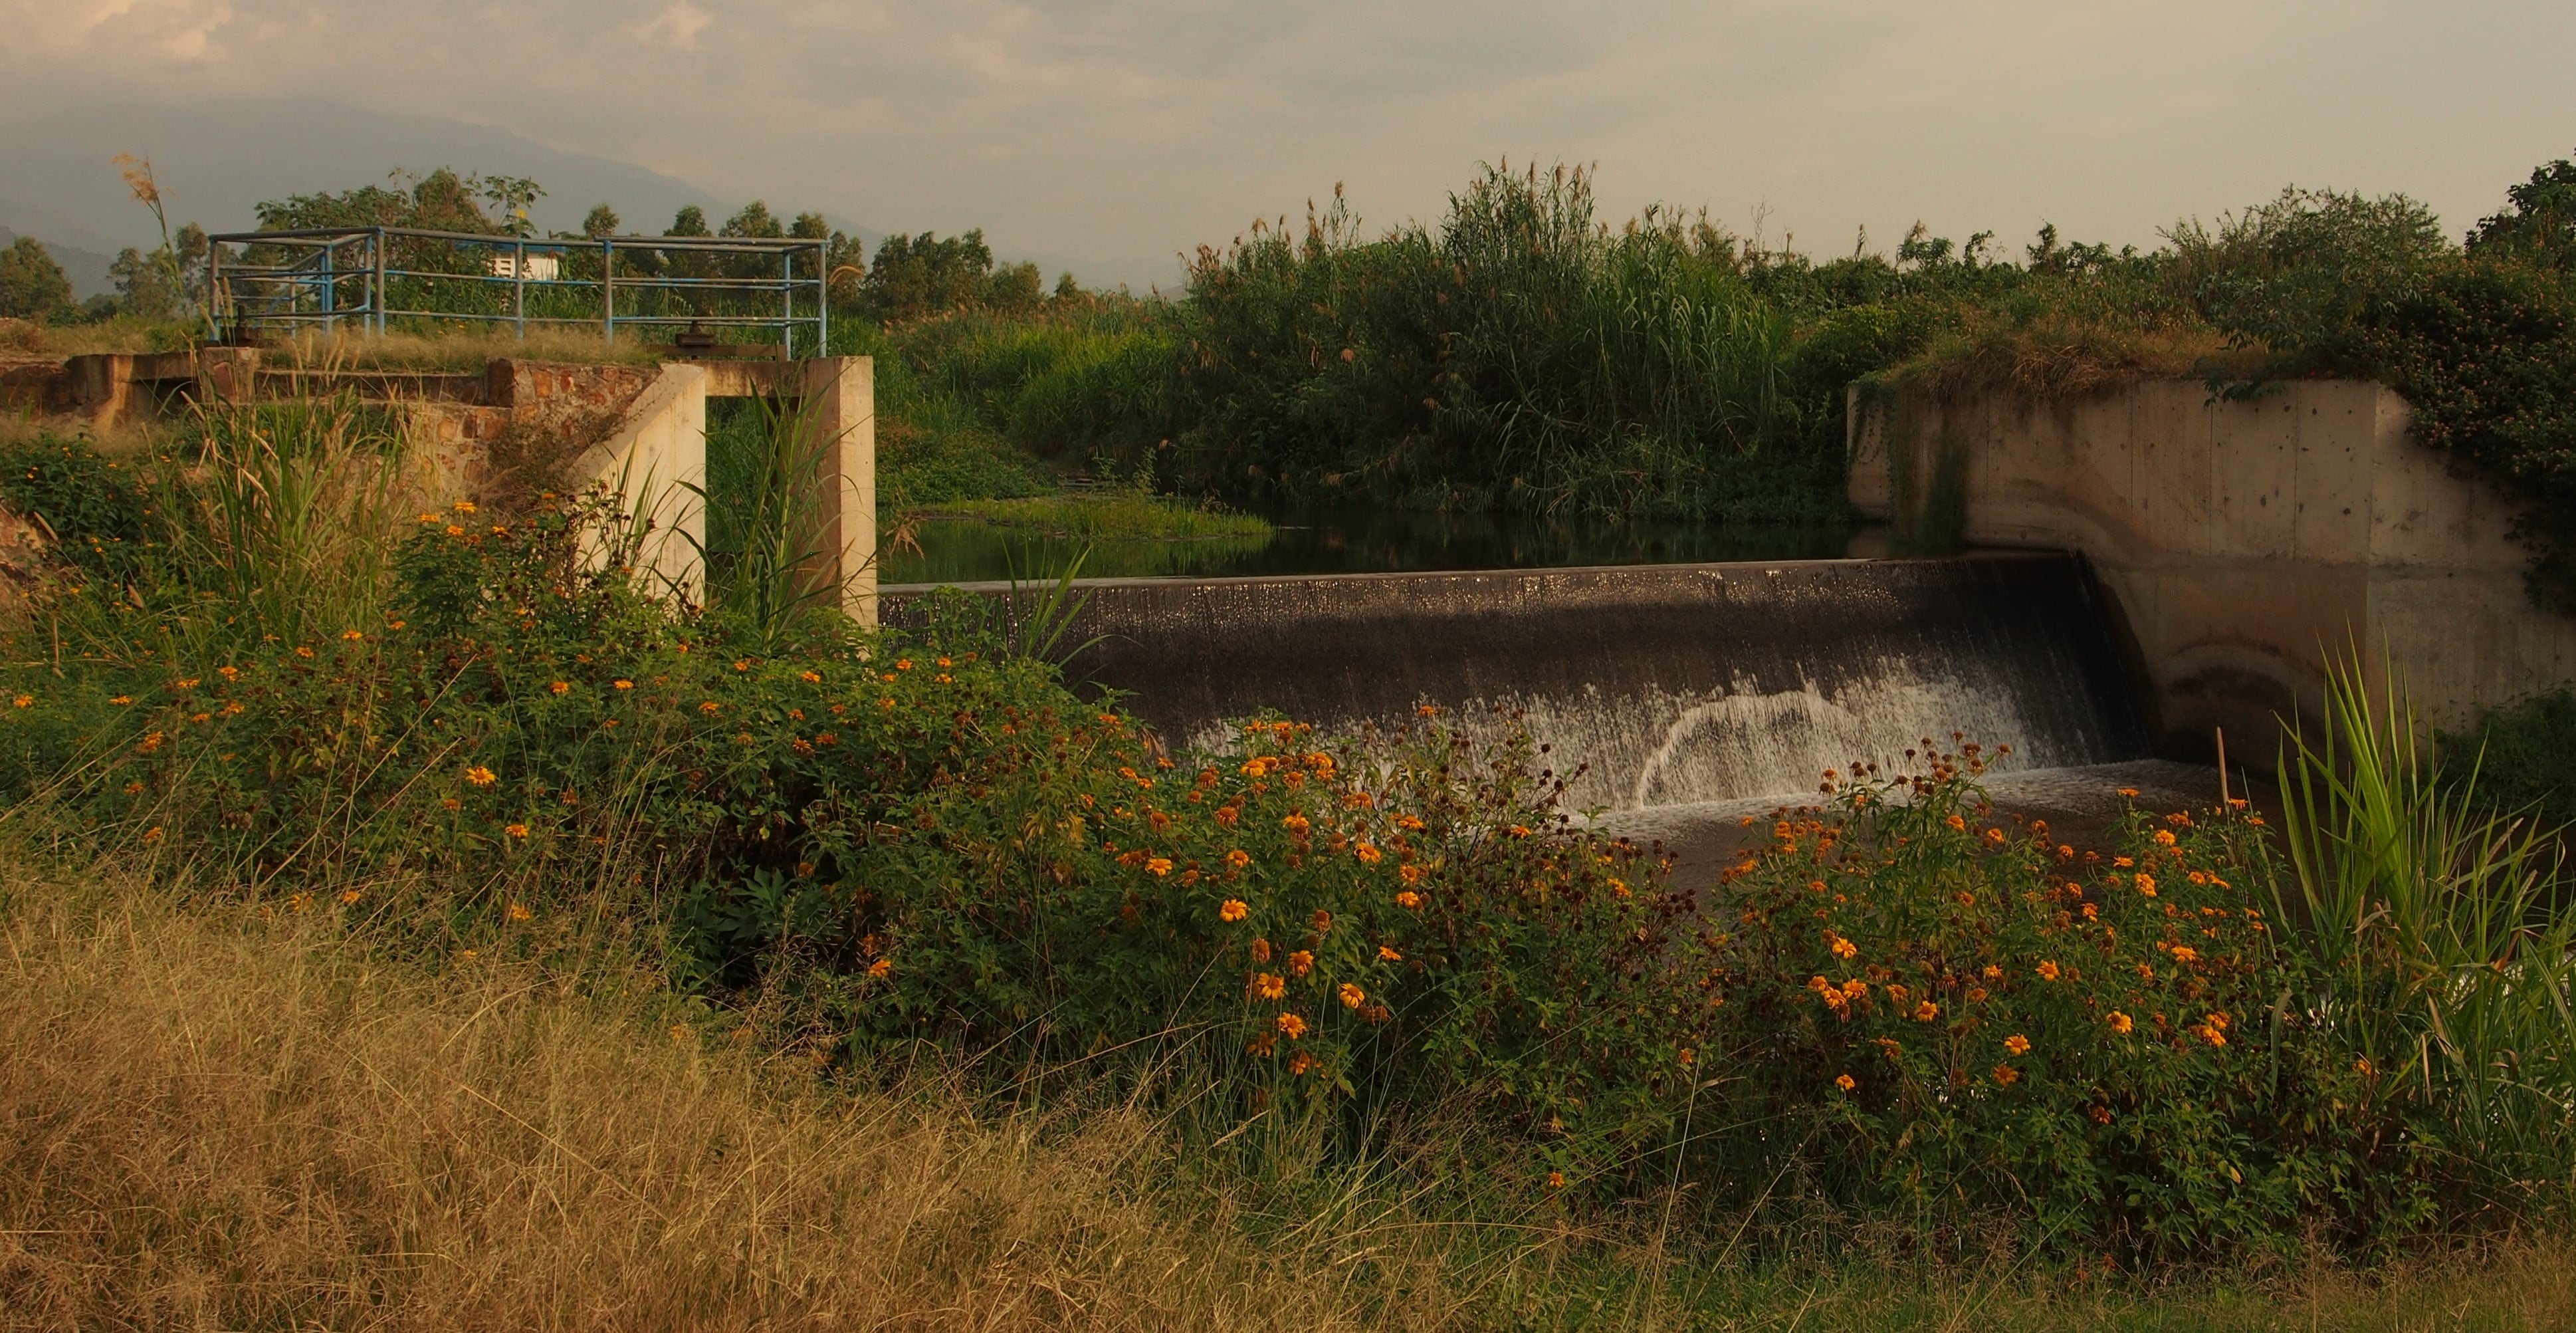
Mubuku, Western Uganda
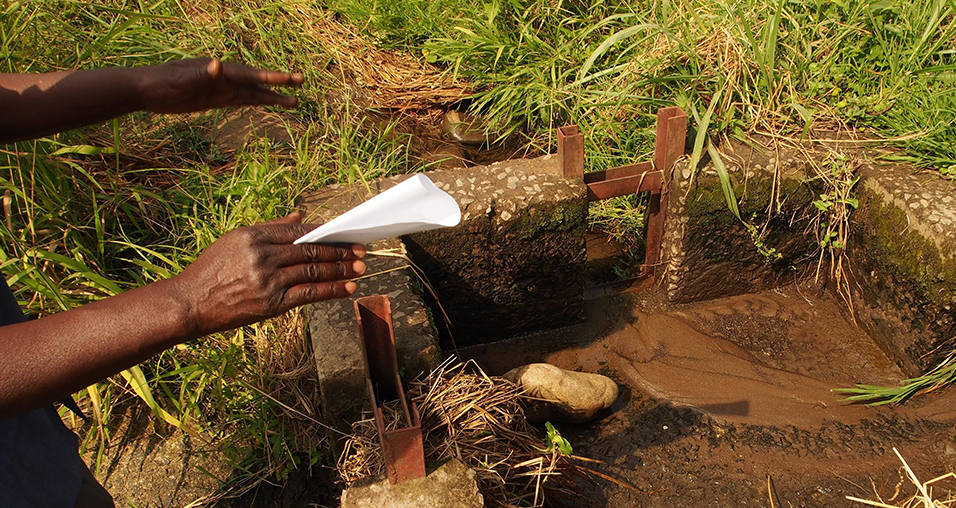
The area holds close to 2000 hectares of smallholder farms watered by drainage channels
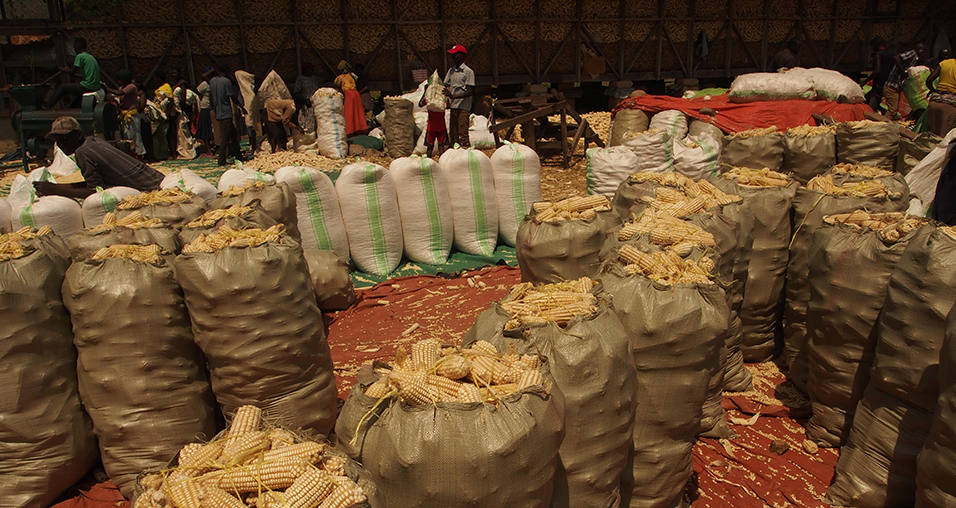
The main crops grown are maize, rice, onions and mangos
The purpose is to find out if crops are overwatered or under stress
In more detail..
This project aims to develop and roll-out a novel algorithm for obtaining evapotranspiration and crop water stress at farm level for a large national irrigation scheme in Uganda.
The site chosen for this project is Mubuku in the Kasese District.
It is expected that the project can lead to 30% less water use for the same yield, which would greatly benefit the local community and farmers.
Since the code will be open source the project can pave the way for better irrigation in drought prone countries.
The project is done in collaboration with our partners, the Ugandan geo-information company, Geo Gecko.
Microsoft and National Geographic AI for Earth Innovation Grant:
A new, joint grant program that will challenge environmental issues of the 21st century with the most advanced technologies available today.
“AI for Earth Innovation” grants will fund new solutions that leverage AI and cloud technologies to monitor, model and manage Earth’s natural resources.
Providing accurate maps of the coastal zone for safe navigation of ships with satellite-derived bathymetry
Satellite-derived bathymetry for guiding nautical navigation
Providing accurate maps for the safe navigation of ships
The challenge:
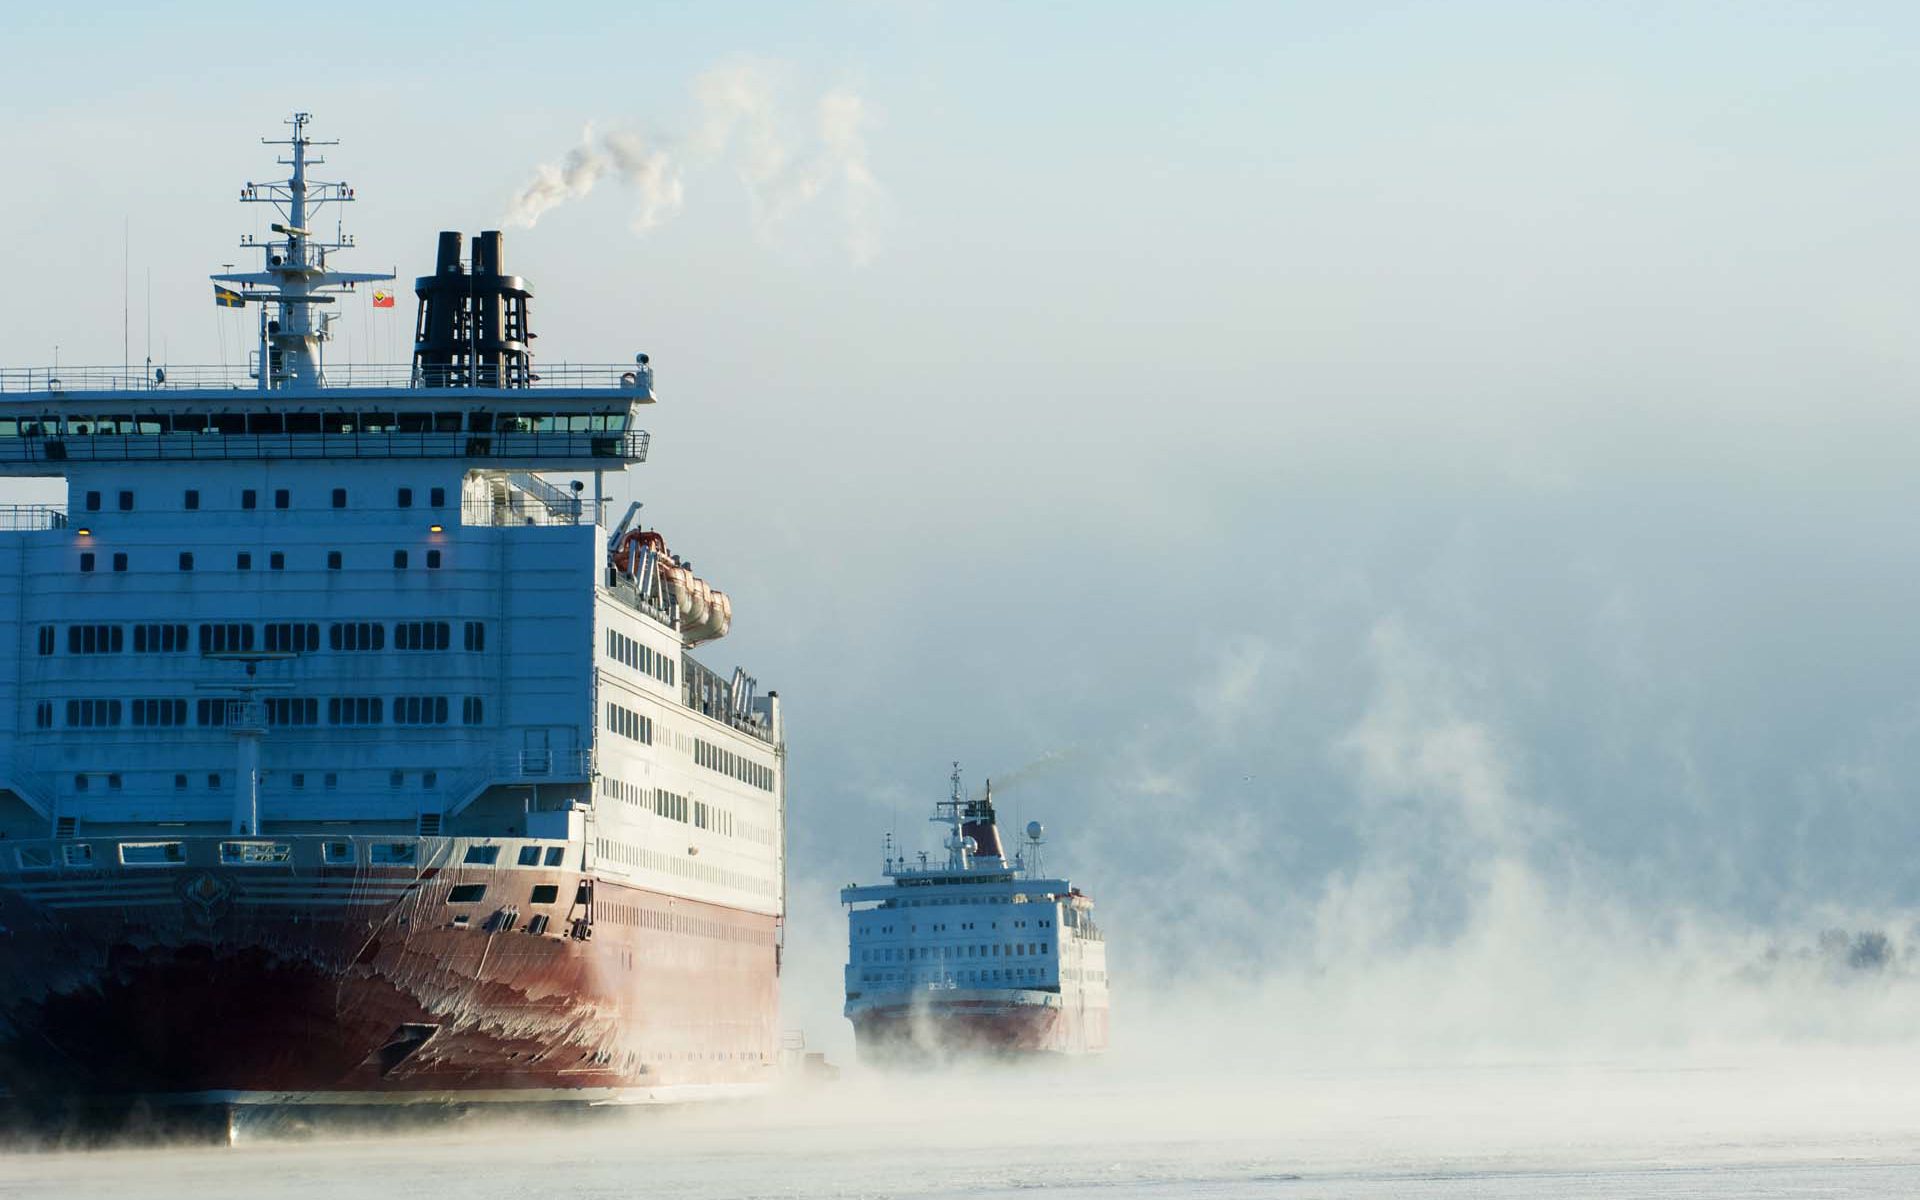
Greenland Pilot Service provides navigational safety services in the Arctic region and their strategy is to contribute to a safe development of the cruise industry in polar regions.
They embark experienced and licensed Polar Code Compliant Pilots on board the cruise vessels. The Pilots contribute with local knowledge and experience, to strengthen the bridge team, ensuring a safe and effective operation.
The 24/7 manned operations center in Nuuk carries out all mandatory Risk Assessments, and continuously updates the pilots with daily information on weather and ice.
To be able to operate safely and ensure best practice, they needed updated information about coastlines and submerged hazards in the poorly charted shallow coastal area around Skjoldungen, Greenland.
Project highlights:
Updated and accurate mapping of coastlines including at high and low tide
Location and size of submerged hazards mapped with clear depiction of small and large submerged hazards
Updated spatial information ensuring safe transport of vessels, ideal for large and remote areas
With the help of satellite-derived bathymetry from DHI GRAS we were able to make a proper navigational risk assessment enabling our clients to safely access the remote and poorly charted waters around Skjoldungen. DHI GRAS did a great job in helping us understand the value of the data and delivery was fast and on time
In more detail..
We were commissioned by the client to provide them with accurately mapped coastlines at both low and high tide, as well as identify submerged hazards, such as reefs, rocks and sand banks.
Sentinel images provided the raw data, which were then analysed and validated. The information derived from satellites is much more accurate than existing nautical charts in the Arctic and allowed Greenland Pilot Services to safely enter the waters around Skjoldungen.
A pilotage company specialised in assisting masters and navigators in their operations in Polar regions.
They carry out mandatory risk assessments and contingency planning according to relevant laws and regulations as well as voyage planning while ensuring compliance with the Polar Code.
Entire geodata web solutions into one package. From data acquisition to intuitive applications for your users.
Your geodata on the web
From satellites through analysis to the web
Why is this important?
Easy access and visualization of geodata is as important as the actual analysis and processing of the data itself. We build modern and intuitive web apps that fit your needs, whether it’s an internal tool for your analysts to query data, or a simple and elegant app for visualizing results.
The solution can be based on tried and true analysis methods or modern AI and machine learning. Our analysts and software developers work together to transform it into an algorithm which can be deployed operationally. We automate the entire pipeline, from acquisition to analysis and visualization.
The highlights:
An algorithm built to solve your exact problem
A modern and elegant web app custom-built to suit your end-users
A modern and elegant web app custom-built to suit your end-users
In more detail..
We build entire geodata web solutions into one package. Data acquisition from relevant sensors and satellites, analysis using our state of the art algorithms and AI, all the way to displaying the data in a custom-built web app, using our own open source raster server.
At DHI GRAS we have experts in both geodata analysis, software- and web development. We leverage this to provide you with a full package solution. We aim for full automation, seamlessly streaming results to your app as soon as they are processed.
Tracking of national wetland inventory in Uganda. Wetland monitoring provides important insights for reporting on the Sustainable Development Goals.
Wetland Monitoring with Earth Observation Data
National wetland inventory for reporting on Sustainable Development Goals in Uganda
Why is this important?
The project has demonstrated how Earth Observation (EO) can support wetland monitoring in Uganda and with continued training sessions can become a valuable tool for wetland managers and practitioners, not only in Uganda, but potentially also paving the way for other East African countries to achieve a wetland inventory in the future.
The highlights:
Delivering a toolbox for wetland inventory mapping and demonstrating how Earth Observation can provide a full national wetland inventory in Uganda
Online portal for SDG reporting on SDG indicator 6.6.1 on wetland extent
Training national stakeholders in Uganda, and other RAMCEA countries, and providing a “lessons learned” and “roadmap” document for roll-out of the method, toolbox and online portal to other RAMCEA countries
In more detail..
The project was a unique demonstration of the full implementation of using Earth Observation to support the monitoring of wetland ecosystems on the national scale in Uganda.
Wetland monitoring is crucial for conservation and restoration of wetland ecosystems in Uganda which is explicitly mentioned in the national development plans. Hence, monitoring and reporting is not only important for reporting on the Sustainable Development Goal indicators, but should be anchored within and used by the national agencies to avoid further degradation of wetlands.
Within this project, a national baseline mapping of wetlands in Uganda was performed for 2016-2017 using all available Sentinel-1 and Sentinel-2 imagery to act as a baseline for SDG indicator reporting.
This also included a training component with three training courses, leveraging the GlobWetland Toolbox for doing national-scale wetland mapping and the inclusion of field data for classifier training and product validation, where the engagement of the local stakeholders and experts are key.
The open source toolbox provided to the local stakeholders consists of a specific component producing statistics and reports for SDG reporting which can be used by e.g. the Uganda Bureau of Statistics who are responsible for the SDG indicator reporting at the national level.
This is available from the online portal where the data, statistics and reports can be explored by users and agencies.
One of the other key aims of the project was to use the implementation in Uganda as demonstration case for uptake of the tools and methods by the other RAMCEA member countries. This was obtained through participation of key staff from the other RAMCEA countries in the training workshops, and by delivering guidance documents on “lessons learned” and “roadmap” for a roll-out.
The online portal for the project is now operated by the Ministry of Water and Environment in Uganda.
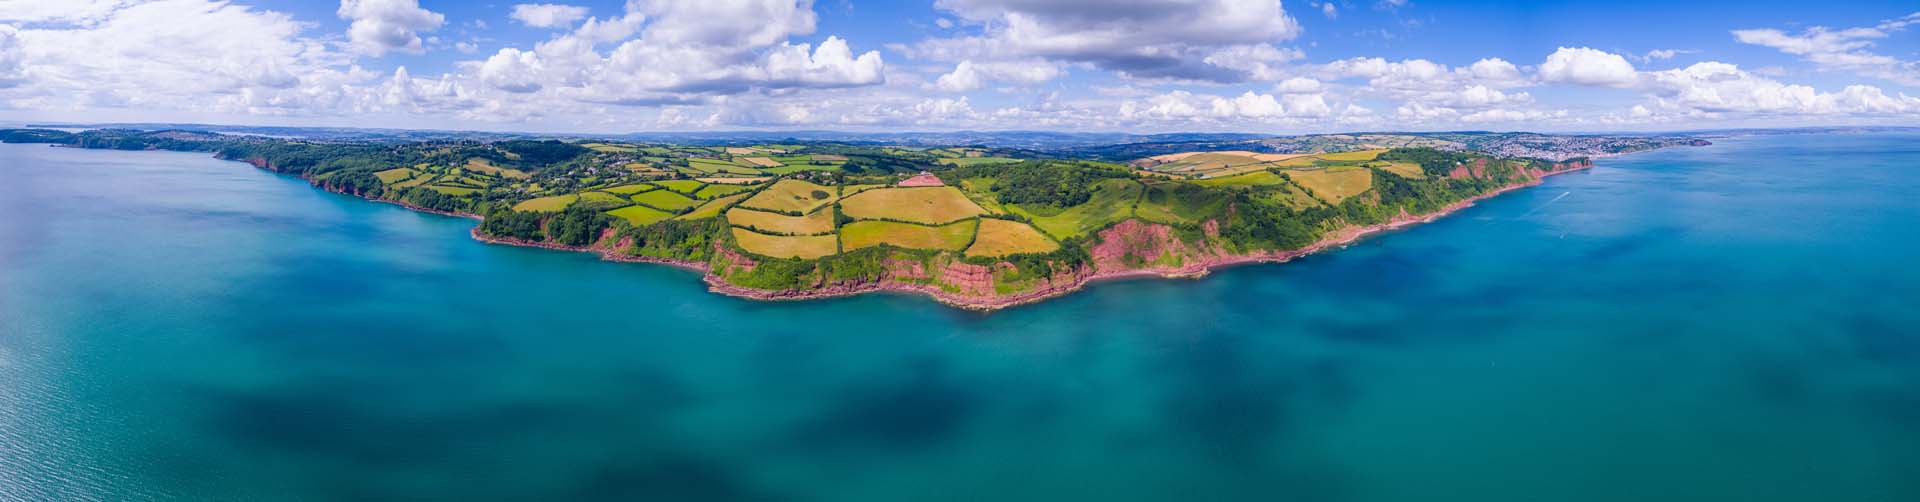
Mapping coastline and coastal zone development and dynamics based on historic and recent satellite data. . . .
Coastline Mapping
Mapping coastline and coastal zone dynamics based on historic and recent satellite data
Why is this important?
Coastal zone managers and port authorities have an advantage when they have access to information about the changes and trends in their coastal area.
Coastline mapping is a solution that uses satellite images and historical archives dating back to the 1960s with the option to combine with existing aerial photographs.
The highlights:
Archives dating back to the 1960’s and recent satellite data provides coastlines that are delivered in ready-to-use vector data format
The coastlines can be derived down to a map scale of 1:1.000, with spatial details of 0.5m to 30m, and comes with flexible options accommodating varying budgets and specifications
Digital maps of the entire coastal zone can be produced with embedded information such as vegetation, sediment, coastal protection, constructions etc.
In more detail..
DHI GRAS has profound experience in mapping coastal erosion and stability classification and with our expertise in this field we can tailor a solution that works for you.
Based on historical satellite data dating back to the 1960’s we can assess and quantify erosion/accretion changes over time. Methods used for extracting coastlines are typically semi-automatic object-based segmentation depending on the nature of the coast and the details needed in the final products.
Further classification of the coastal zone can be derived based on the timeseries of satellite data to extract information about dynamics and development of vegetation, coastal protection, constructions etc.
Tidal information can be considered by adding corrections based on DHI tidal models.
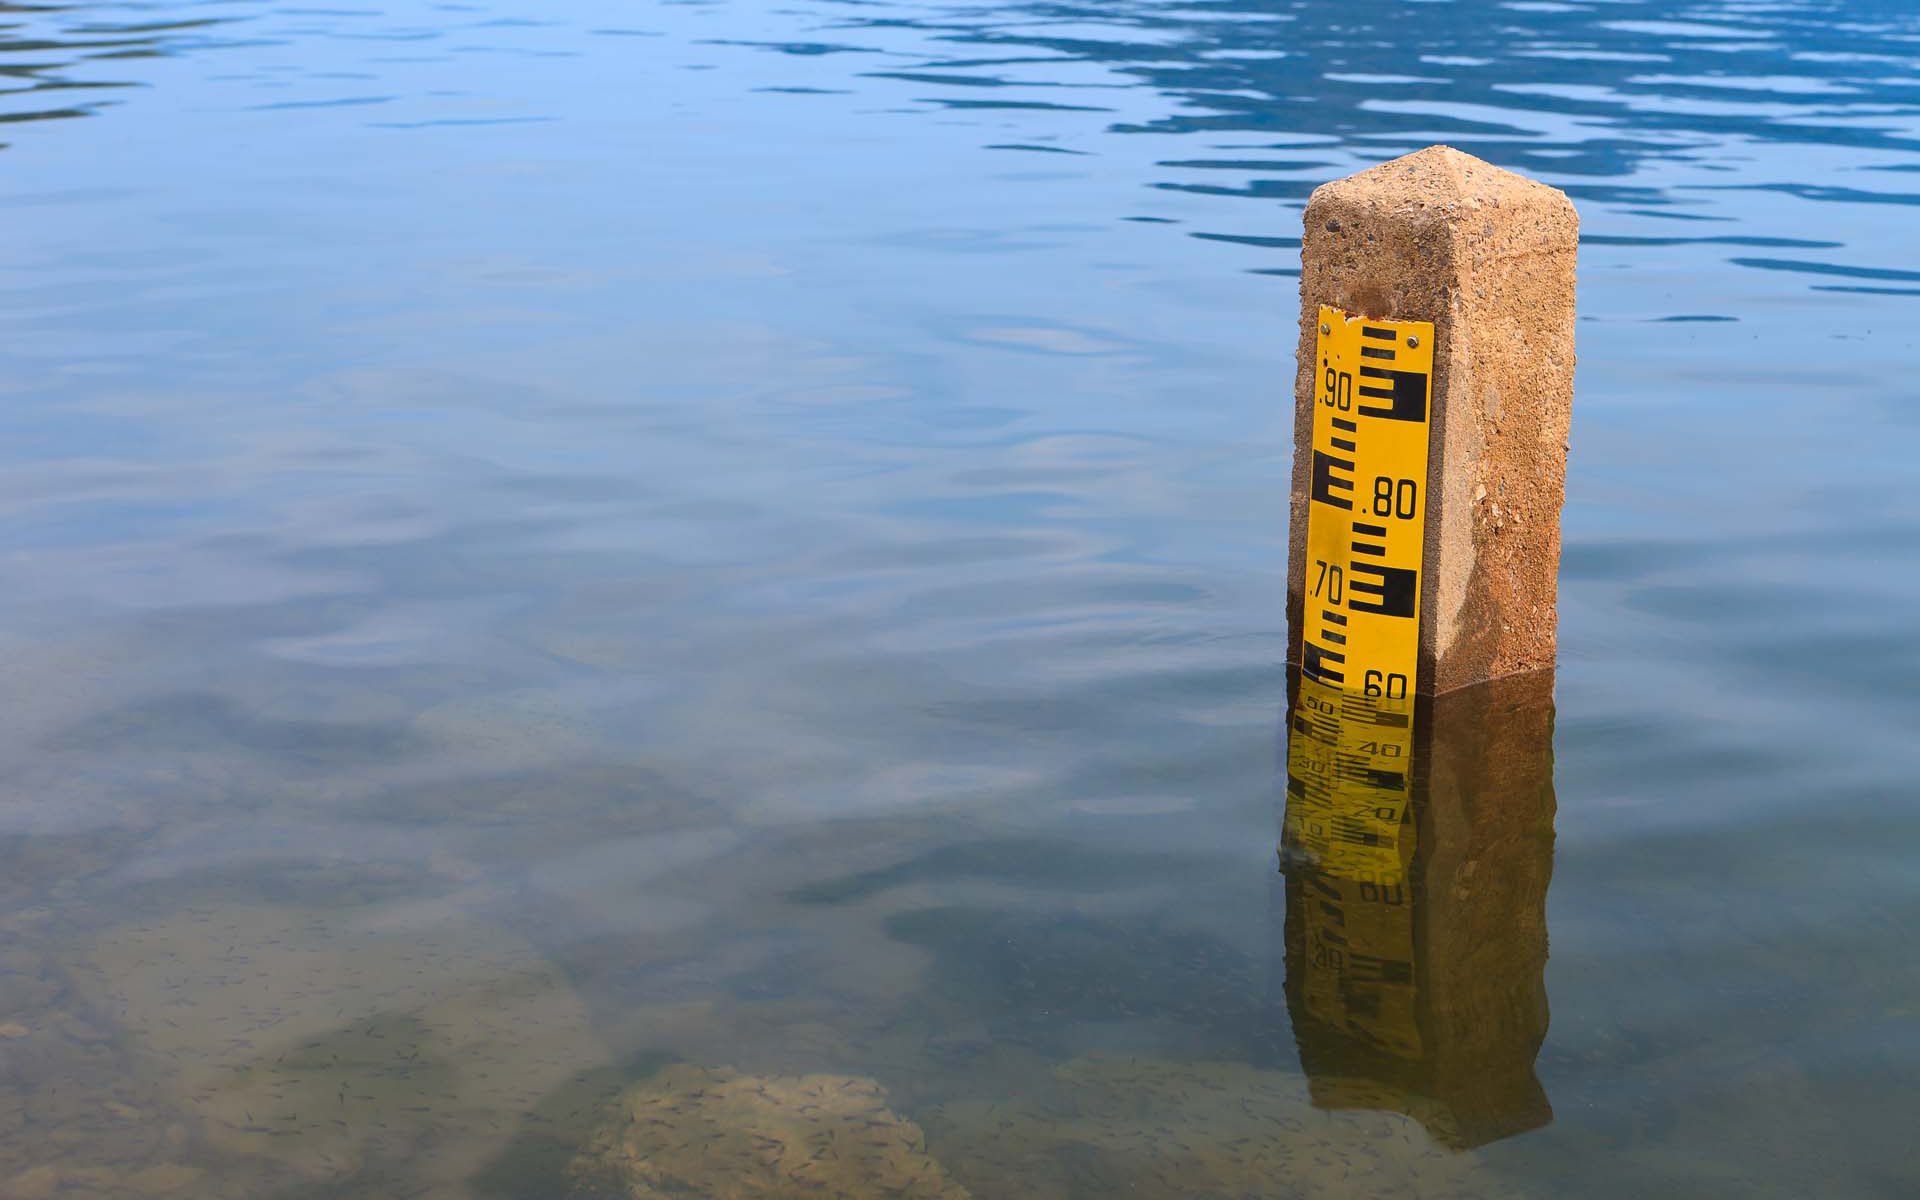
Nonitoring the right data and information is crucial for governments in flood and drought situations.
Flood and drought monitoring and prediction
Providing reliable data streams and applying complex analyses on a wide range of remote sensing and climate data
Why is this important?
Flood and drought monitoring provides access to the right data and information for governments and local authorities. This enables them to mitigate potential disasters.
Project highlights:
Reliable near-real-time remote sensing data and climate forecasts for flood and drought management on country and river basin scale
Automated data streams from a wide range of online sources for satellite-based rainfall, temperature, soil moisture, NDVI, water levels, chlorophyll, evapotranspiration, and more
Statistics and complex indices based on latest science that support in-depth analysis of severity of flooding and drought events
In more detail..
Increased floods in some areas and droughts in others, is having a substantial impact on the ecosystem and agriculture of the affected region and harming the local economy, often hitting developing countries the hardest.
The Flood and Drought project is working on a groundbreaking online system containing an array of data such as hydrographic, meteorological and demographic information in near-real time piloted by 10 water authorities across six countries and three transboundary river basins. This is a packaged solution providing not only data and information but also tools to integrate this information into the users planning.
The online portal allows for the users to locate and identify hazards, estimating impacts and providing risk assessment. It also includes a water indicator tool and water safety planning to support decision making as well as an application to understand crop yields.
To make the information accessible to stakeholders, we maintain data streams from more than 20 different online sources of remote sensing and climate data.
We compute statistics and complex indices based on latest science for enhanced assessment of flood or drought severity, available on country or river basin scale.
Satellite-based evapotranspiration for improved crop water efficiency in Uganda. Using Artificial Intelligence to assess evapotranspiration, saving up to 30% in irrigation consumption