Supporting the development of coastal measurements in Copernicus from the Sentinel satellites
Why is it important?
The requirements from end-users and the wide range of applications underpin how crucial the development of oceanographic products is.
The H2020 CEASELESS project is contributing to a better understanding and prediction of coastal oceanography based on developments in satellite and in-situ data as well as high resolution models and novel assimilation approaches.
Project highlights:
Application of new Sentinel data to extract a spatial structure for coastal processes
Application of met-ocean predictions for users as a proof of concept for the new prediction capabilities, highlighting application limits and providing feedback for further developing their coastal dimension
New higher resolution and prediction capabilities for met-ocean variables, to allow for coupling and assimilation at unprecedented scales
In more detail..
The new Sentinel data, together with existing satellite measurements, are supporting a much needed spatial structure to complement the temporal variability captured by in-situ timeseries.
The CEASELESS project has applied the new Sentinel data to selected pilot sites to allow for efficient testing of unstructured grids to better capture coastline irregularities and sea bed geometry and forms.
The pilot sites will allow for more efficient analysis approaches globally, and more specifically in the North Sea and Mediterranean Sea. This serves as proof of concept for the role that coastal processes play in the meteo-oceanographic predictions and the importance of combining in-situ data with satellite measurements for restricted coastal domains.
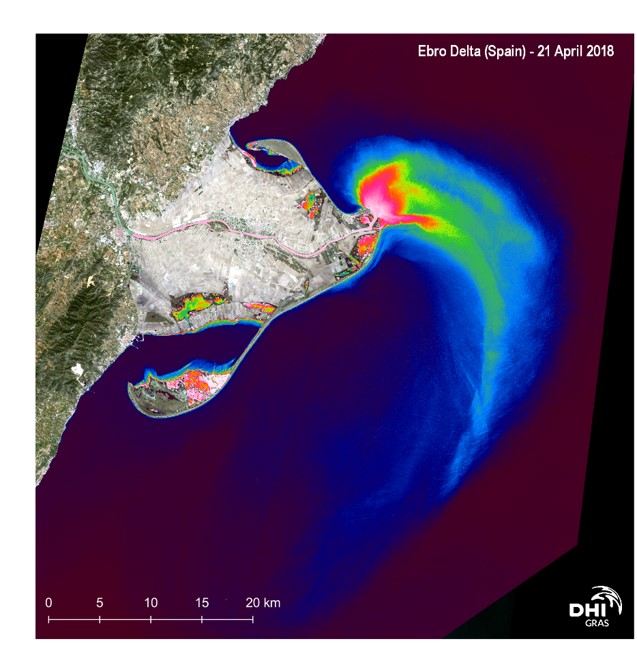
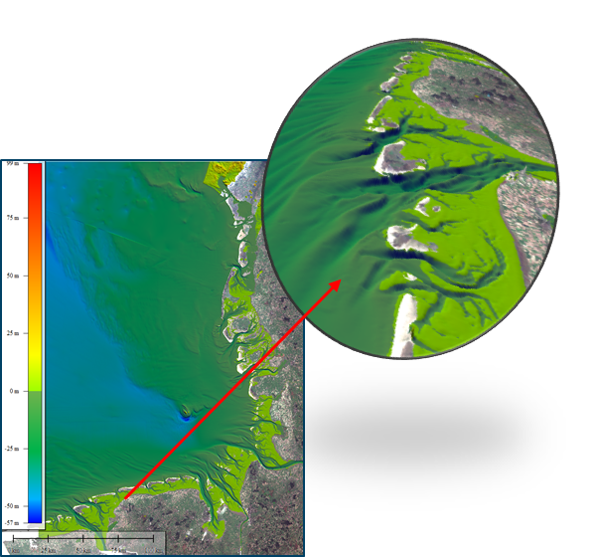
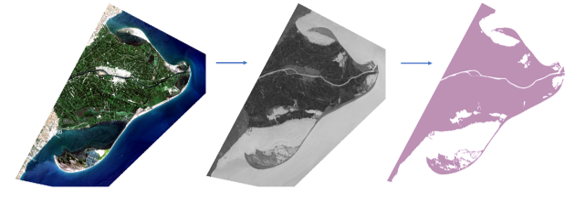
In CEASELESS, DHI GRAS is acting as the optical remote sensing expert providing Sentinel-2 based satellite-derived bathymetry , water quality data and information on coastal dynamics. Tied up in a cloud-based processing environment a truly scalable approach has been designed capable of delivery of large-scale coverage globally.
Suspended matter
Satellite derived Bathymetry, German Bight
Showing the workflows from input imagery to derived index to a final vectorized coastline
European Commission:
CEASELESS is funded by the European Union’s H2020 Programme for Research, Technological Development and Demonstration under Grant Agreement No: H2020-EO-2016-730030- CEASELESS.
H2020 is the biggest EU Research and Innovation programme and a financial instrument aimed at securing Europe’s global competitiveness by driving economic growth and focusing on research as an investment for the future of Europe.
Determining the extent of satellite data from Sentinel 1 and 2 for automating the categorization and quality assurance of mapped lakes in the GeoDanmark dataset . . . .
Sentinel-based change detection for GeoDenmark
Determining the extent of satellite data from Sentinel 1 and 2 for automating the categorization and quality assurance of mapped lakes in the GeoDanmark dataset
Why is it important?
The results of this study provides the basis for using satellite data sources and Machine Learning methods for a nationwide automated classification and quality assurance of topographic maps in the GeoDanmark dataset.
A further development of the methods could make a nationwide screening of all lakes in Denmark possible.
Project highlights:
Using Sentinel time series and Machine Learning to validate lakes in existing topographic maps
Providing quality managers with a cost-effective tool to prioritise efforts with quality assurance of existing and future data sets
Showing the possibility of a nationwide screening of all lakes in Denmark in the future
In more detail..
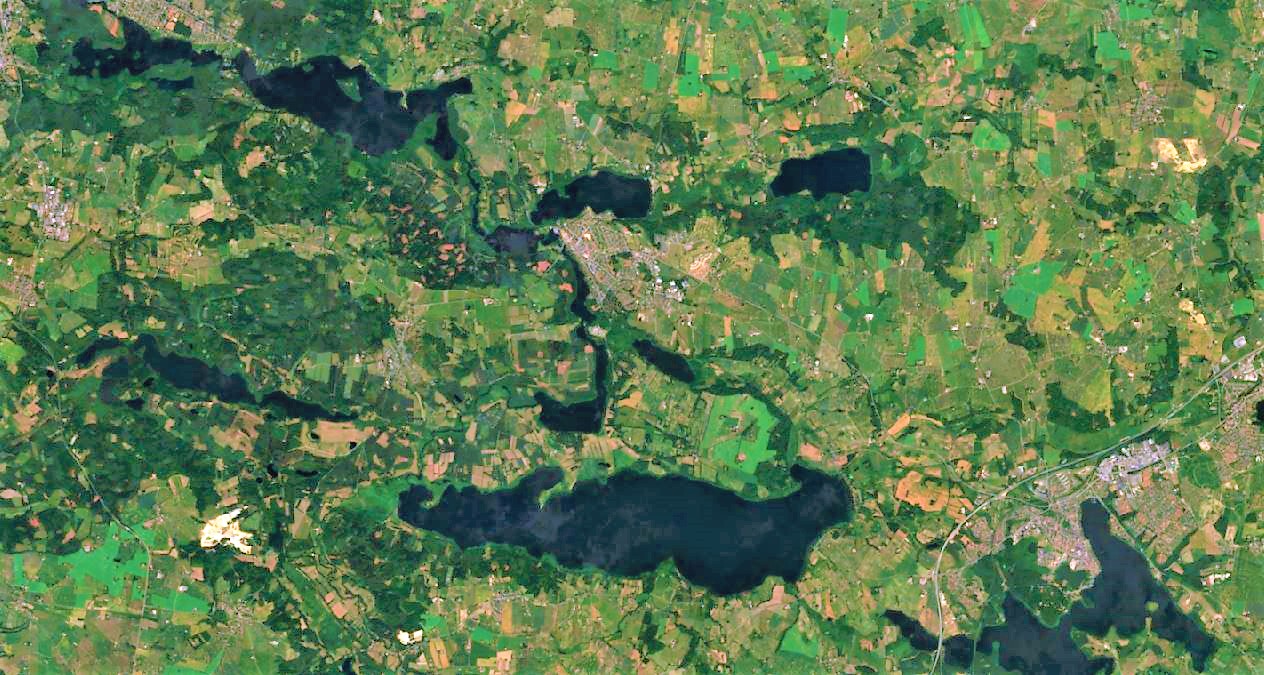
A study area covering parts of Northern Jutland was analysed using relevant Sentinel 1 and 2 satellite imagery from 2017.
The temporal resolution of Sentinel-1 is high, and it therefore has the advantage of providing large amounts of data throughout the year. However, it is limited in its spatial resolution which makes the classification of relatively small objects difficult e.g. small lakes, since they do not show on the images.
Sentinel-2, on the other hand, has the advantage of having a significantly better spatial resolution, which enables the classification of small lakes. Here, the limitation is that clouds and shadows limit the temporal resolution.
Combining data from the two satellites, would therefore give a better data coverage.
We found that a relatively large portion of the mapped lakes in the GeoDenmark dataset, from a Sentinel-based point of view, either cannot be described as lakes or may be deviating from the existing categories.
The results of this study indicates that there are good prospects in using the Sentinel-based data sources and methods for a nationwide automated classification and quality assurance of topographical maps, such as the mapped lakes in the GeoDenmark data set.
In this study, we focused on previously mapped lakes in the GeoDenmark data set, but it is expected that the same method could be used to map lakes that do not already exist in the dataset.
Based on a limited further investigation of the methods used, it is estimated that a nationwide screening of all lakes in Denmark, approx. 180.000 in total, could be automatically categorized and figure in the GeoDenmark dataset for lakes.
The Danish Agency for Data Supply and Efficiency:
The agency provides the public and private sector with high-quality data, enabling them to make important community decisions based on the best available information.
The agency is part of the Energy, Supply and Climate Ministry in Denmark.
Monitoring chlorophyll and submerged aquatic vegetation in Danish coastal waters with remote sensing technologies . . . .
ReSTEK - Remote sensing technologies for coastal monitoring
Monitoring chlorophyll and submerged aquatic vegetation in Danish coastal waters with remote sensing technologies
Why is it important?
Remote sensing technology can provide systematic and cost-effective information of the marine and coastal environment at large scales.
This is of interest to public authorities, looking to further increase the effectiveness of national monitoring programs through the inclusion of novel technology.
Project highlights:
Assessing the potential use of air and spaceborne remote sensing technologies for monitoring submerged aquatic vegetation in the nearshore coastal zone of Danish waters
Mapping the distribution of benthic habitats to expand the knowledge about e.g. eelgrass area coverage as an indicator for water quality status
Evaluating the use of Sentinel 2 and 3 satellites for monitoring surface chlorophyll concentration to improve the temporal resolution and the spatial distribution of the current water quality monitoring program
In more detail..
The Danish Environmental Protection Agency initiated a 2-year activity in 2017, where DHI GRAS was in charge of satellite analyses of water quality and benthic habitat mapping for selected Danish water areas.
We examined the potential for using remote sensing technologies in connection with the current Danish national NOVANA (National Monitoring and Assessment Programme for the Aquatic and Terrestrial Environment) monitoring program.
The first part of the project looked at the distribution of eelgrass using data from the Sentinel-2 satellites. Eelgrass is an important water quality indicator and has been included in the Danish water plans to assess the environmental state along the Danish coasts. The eelgrass distribution reflects the clarity of water and nutrient richness and thereby indirectly the quality of the water.
The most common practice for mapping eelgrass meadows is to record the distribution along a transect line with a diver, which is costly and unsuitable to derive the complete temporal and spatial eelgrass cover of the Danish coastal waters.
An updated nationwide map of the eelgrass distribution therefore has several potential uses in the Danish water plans:
1) For further development of eelgrass as an indicator of the coastal areas' condition
2) In connection with land-use planning and concrete protection of eelgrass meadows
3) For quantification of eelgrass's ecosystem services
The second part of the project looked at the chlorophyll concentrations in the Danish surface waters using data from Sentinel-2 and Sentinel-3 satellites.
Chlorophyll concentrations are regularly determined by a chemical analysis of water samples which are collected from a ship and subsequently undergone trial processing in the laboratory. Because this type of traditional sampling is costly, usually measurements are taken at only 1 location per water area, approximately every 14 days.
This limits the ability to document the spread and temporal dynamics of important events such as algae blooms and leads to relatively large deviations in seasonal means.
The combination of Sentinel-2 and Sentinel-3 provided a cost-effective way to supplement national in-situ monitoring of surface chlorophyll in the shallow Danish coastal waters, in order to improve the temporal and spatial distribution of chlorophyll concentration.
Satellite technology cannot replace in-situ sampling completely, but it can optimise sampling design and fill gaps.
By bringing together information from various sources, the confidence in the data can be enhanced and greatly improve national assessments.
Chlorophyll summer mean 2018 from Sentinel-3 for Roskilde Fjord and Isefjord.
The Danish Environmental Protection Agency:
EPA is the authority in charge of preparing legislation, granting authorisations and providing guidelines within the fields of the environment and health: chemicals, pesticides, gene technology, soil, waste and environmental technology.
The range of tasks is broad, from algae bloom detection and regulations for chemicals in hair colourants, through investigations into how more waste can be recycled and authorisations for new pesticides to the handling of fruit and vegetables.
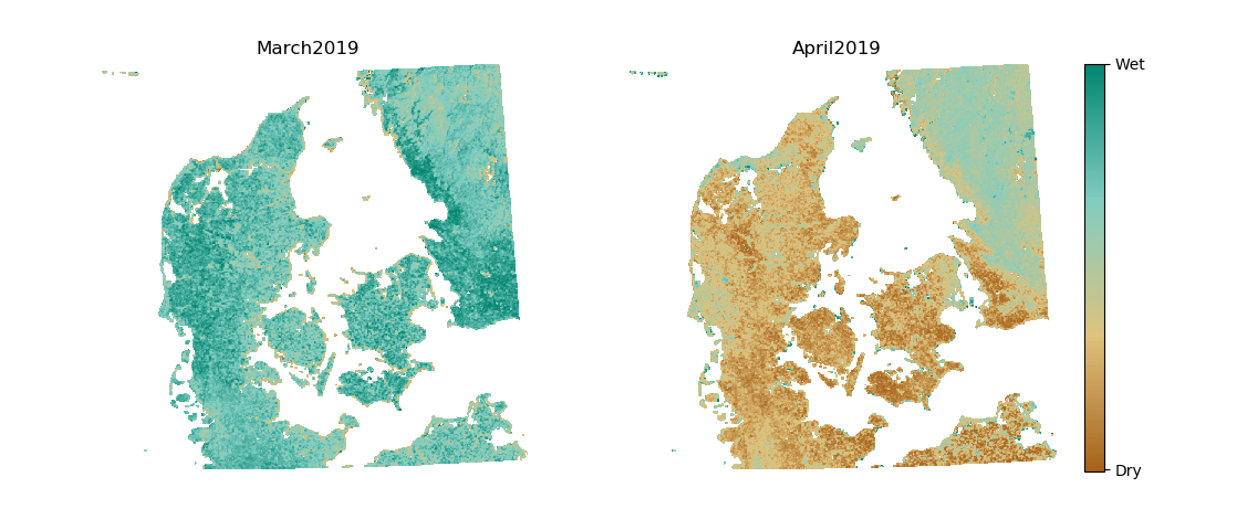
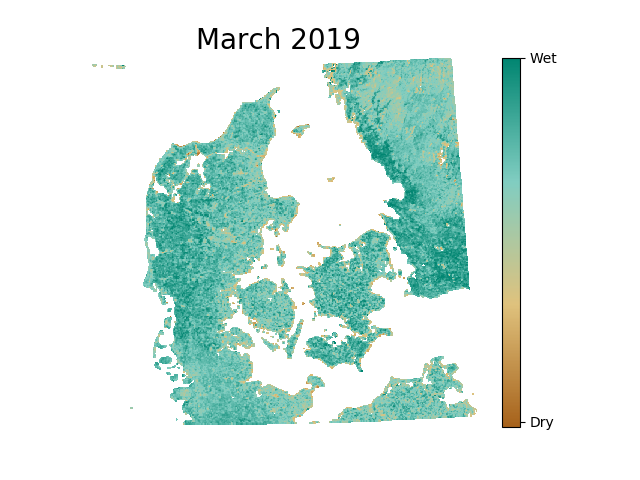
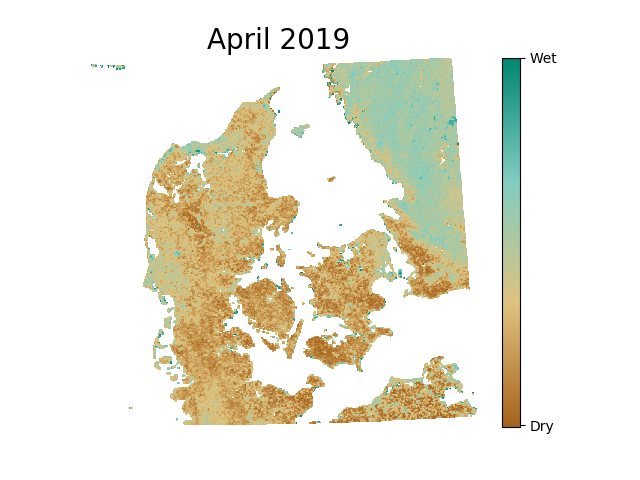
A new rainfall record in March was followed by a very dry April with record sunshine hours.
Recent weather patterns in Denmark is giving us an opportunity to show you how satellites can be used to extract soil #moisture from the Sentinel-1 radar satellites.
Using cloud-penetrating Sentinel-1 observations we were able to get almost daily soil moisture measurements in both months, despite March having only 119 sunshine hours compared to 274 hours in April.
The images show the monthly average surface soil moisture for March and April this year and clearly illustrates the unusually wet and dry conditions compared to previous years.
DID YOU KNOW?
Soil moisture is a key variable to understand many environmental processes such as vegetation health, #drought and #flood risks and plays a large role in climate models.
Changes in soil moisture of the top few centimeters of soil, greatly influences the characteristics of the soil, which makes it possible to measure with radar instruments mounted on satellites.
DHI GRAS is working together with DHI on assimilating satellite based soil moisture observations into complex hydrological models.
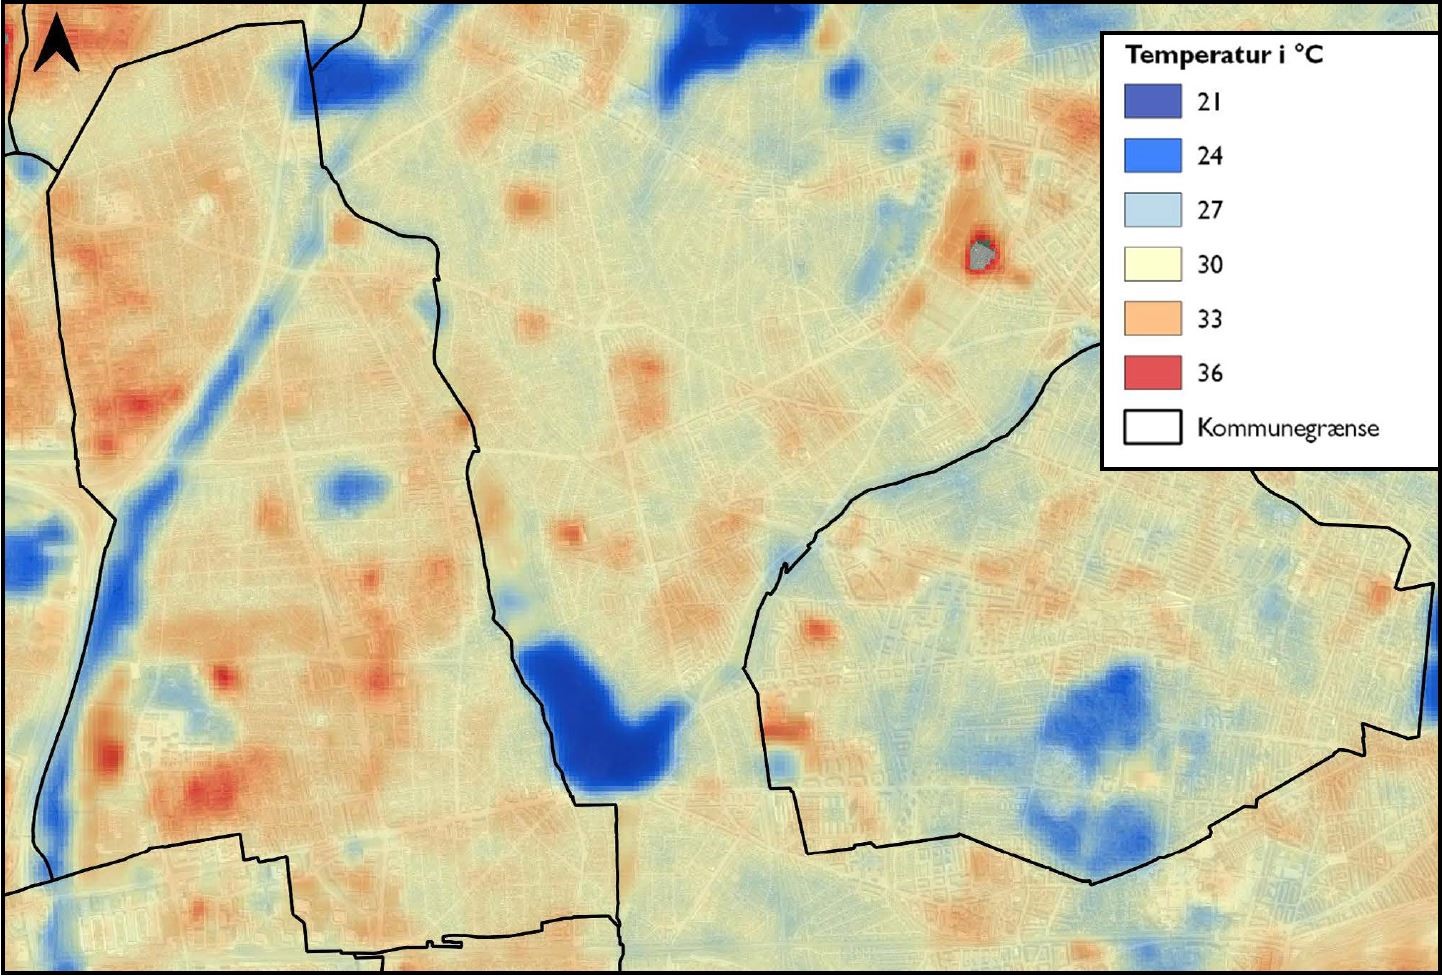
Urban Heat Islands mapped for Rødovre municipality:
20 May 2019
Our Urban Heat Island data can be found in the Sustainability Report 2019 from Rødovre municipality. The yearly report is part of the municipality’s Agenda 21 strategy, where they use sustainability as the basis for the development of Rødovre.
We provided a land surface temperature map, that illustrates the large variance in temperatures across the municipality depending on the urban land use. The map shows a 15 degree difference between some areas, which is dependent on the presence of vegetation and water bodies, due to their “cool down”-effect in contrast to the heating effect from the built-up areas.
We have previously done similar work for the municipality of Copenhagen, where we found a 12 degree difference between areas in the city throughout a very warm and dry summer.
UHIs are a concern in many cities, and known to have significant impacts on the lives of the residents in urban areas as well as the urban environment.
Interested in using satellite data to map Urban Heat Islands for your municipality? Contact us at gras@dhigroup.com
The extra information has provided a huge leap forward in computer vision capabilities and is used to more accurately identify specific objects and land cover classes of interest.
The application of Deep Learning (DL) to analyse satellite imagery is paving the way for the Earth Observation field to reinvent itself.
This can extend the reach through novel idea-thinking to solve new challenges and optimise traditional ways of monitoring and mapping.
Thanks to the exponential growth of active satellites together with advancements in Big Data and Cloud Computing, information from space is becoming more accessible.
This allows for enormous quantities of data to be stored and analysed at a much faster pace.
At DHI GRAS mapping of specific features of interest and land cover is a key service delivery. We are experts in extracting information from satellite imagery to meet our client’s needs.
A common approach has been to train classical machine learning algorithms (e.g. Support Vector Machine or Random Forest) to label each pixel in a satellite image.
However, one of the shortcomings of this approach is that each pixel in the image is classified independently of its neighbouring pixels – meaning the spatial context in imagery is not considered.
The main advantage of Deep Learning algorithms is that they can recognize patterns, shape, and context in imagery, and use this to better map different objects of interest.
By doing so, they use not only the spectral information from pixels, but also the surrounding spatial information that is associated with objects.
Land Cover Mapping
Our Deep Learning Lab has seen significant improvements in land cover mapping using latest DL algorithms for image segmentation.
For large area mapping we take advantage of imagery provided by the European Space Agency’s Sentinel satellites. These satellites deliver state-of-the art optical and radar imagery free of charge for the entire globe – which have revolutionized mapping capabilities since they were launched in 2015.
Using this imagery in combination with Deep Learning has greatly improved our capabilities in mapping specific land cover or land use types including water & wetlands, crop-types, irrigated areas, forests and many more.
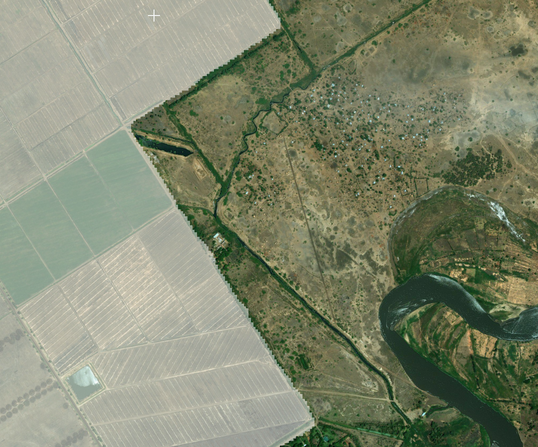
Mapping of irrigated cropland in Malawi using Convolutional Neural Networks (CNN) and Semantic Segmentation.
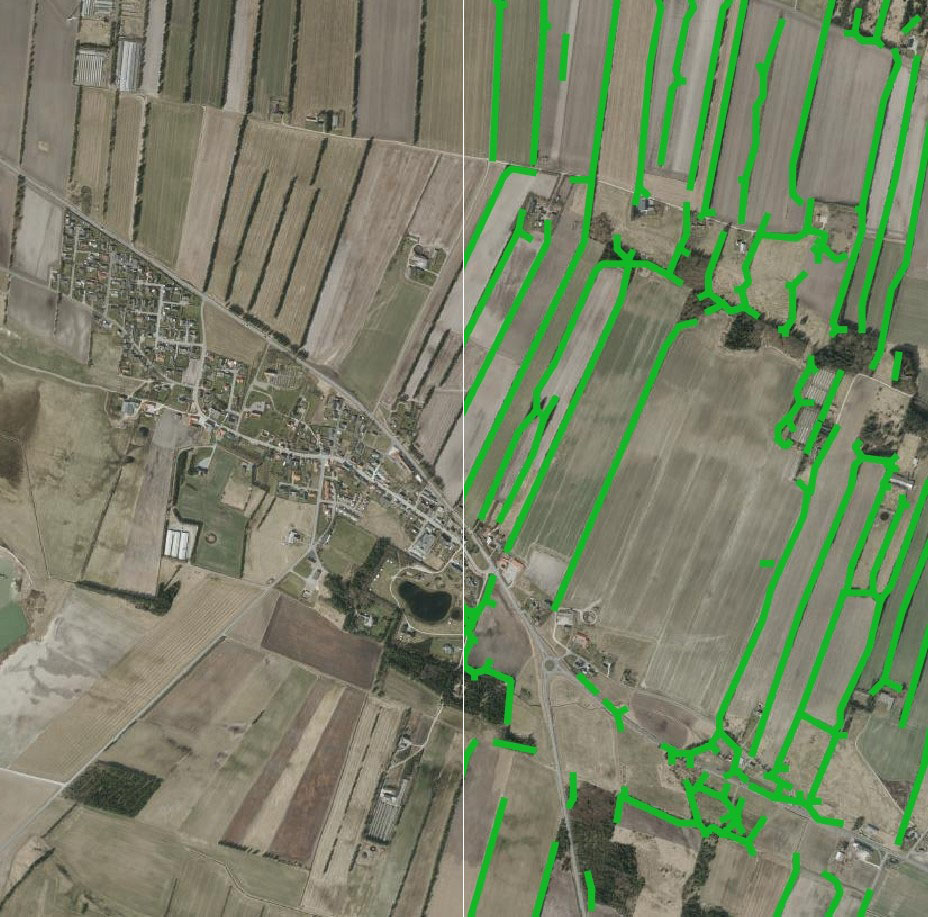
Mapping ‘wind breaks’ in open landscapes using Deep Neural Networks. Satellite imagery (left), predicted windbreaks (green outline) from the Deep Neural Network (right).
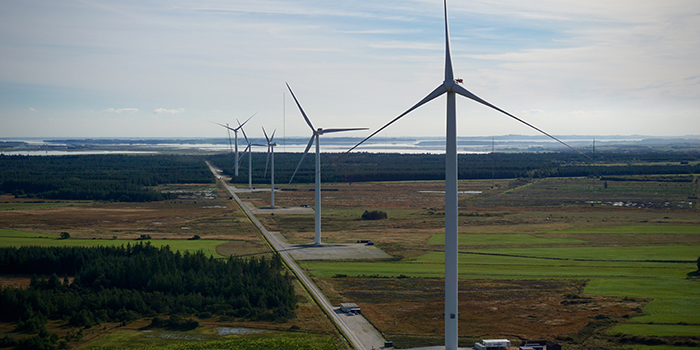
Mapping wind breaks in open landscapes
One of the latest innovations we have been working on is mapping ‘wind breaks’ in open landscapes, relevant for the wind power industry. Wind breaks are barriers such as tall fences, walls and hedges located throughout the landscape which can increase the surface roughness and drag, and decrease the expected wind flow. Information on the location of windbreaks is therefore important when making wind flow models and planning the location of wind turbines.
Interestingly, this DL network was originally designed for biomedical image segmentation, however it has proved highly useful when applied to satellite imagery. We trained and validated the model on Sentinel-2 imagery using a sample of known wind breaks throughout Denmark, with impressive results. Once identified, these wind breaks can then be used for better estimation of surface roughness.
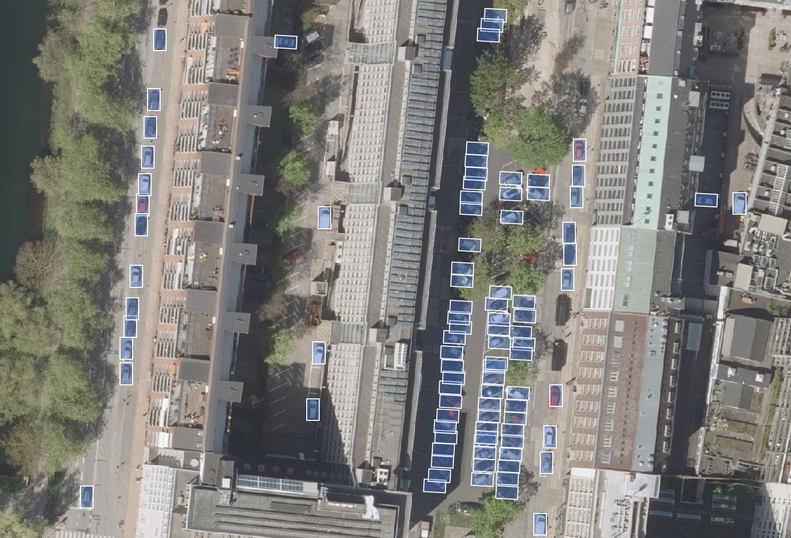
Object Detection
We have also had much success with using DL for object detection and recognition in satellite and aerial images. We have found that many of the DL models used in other fields such as biomedical imaging and self-driving cars, work equally well on satellite images, with little adaptation.
Furthermore, we have been able to use transfer learning, to leverage models pre-trained on more general image datasets, . This is great news, since it enables us to get good results with comparatively little training data.
In short, this means that we can detect objects such as cars, solar panels, swimming pools, etc. with high accuracy and short turnaround for delivery, while only requiring a small amount of training data even for larger areas.
Locating solar panels on rooftops using Deep Learning.
Tracking cars in urban areas with Region-based Convolutional Neural Network (R-CNNs).
Powerful new advancements
Modern Earth Observation holds great potential to bridge the gap between Remote Sensing and AI, and allows for users to gain insights like never before.
At DHI GRAS, we are intrigued by the developments we are seeing in this field.
We are working hard in our Deep Learning Lab to explore what is possible and inspire our clients to think in new ways. Our aim is to create awareness of how DL has the potential to significantly optimize existing workflows.
We welcome all ideas – so if you have an object you would like us to map, we can be reached at gras@dhigroup.com.
Authors: Philip Graae (phgr@dhigroup.com) & Kenneth Grogran (kegr@dhigroup.com)
Working with satellite imagery would be much easier if there were no clouds obstructing the view from satellites that orbit the earth far above the clouds.
Luckily, there are several clever ways to solve this problem. One way is to stitch satellite images of the same area together to create a composite.
Composites can be computed for any period of time, e.g. monthly, yearly, and for any area around the world.
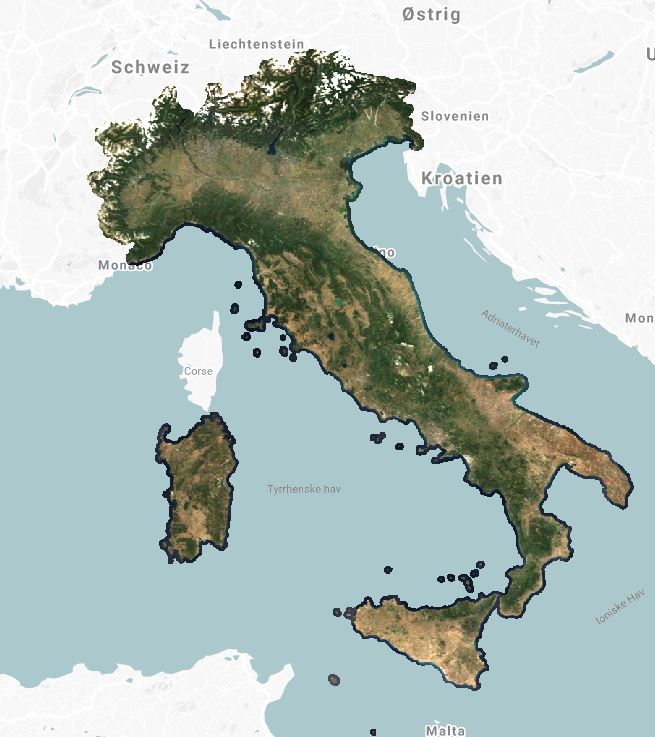
Italy through the clouds
We have compiled a cloud-free composite of Italy, based on thousands of individual Sentinel 2 images from 2018, which can be accessed through our SATLAS site.
Image artefacts, such as orbit path and tile seamlines, cloud and cloud shadow interferences have been removed by our processing, creating a truly analysis-ready data layer, available at full Sentinel 2 resolution.
Use it for land cover classifications or for simple visualizations.
We have also previously produced monthly Sentinel 2 composites for crop type classification in Denmark and made seasonal composites for mangrove mapping in Myanmar.
One of the many key inputs to wind modelers is forest height information as forests have structural characteristics that affect the wind profile.
We have developed a model to predict forest heights using satellite-based methods. The models take the forest height calibration data and finds relationships between the known heights and the predicted variables from Sentinel and Landsat.
We validated the results by comparing predicted forest height estimations with the validation dataset achieving a Mean Absolute Error (MAE) of about 2 meters, which is well within the acceptable range needed for improved wind flow modelling.
Copyright: DHI GRAS, contains Copernicus Sentinel data (2019)
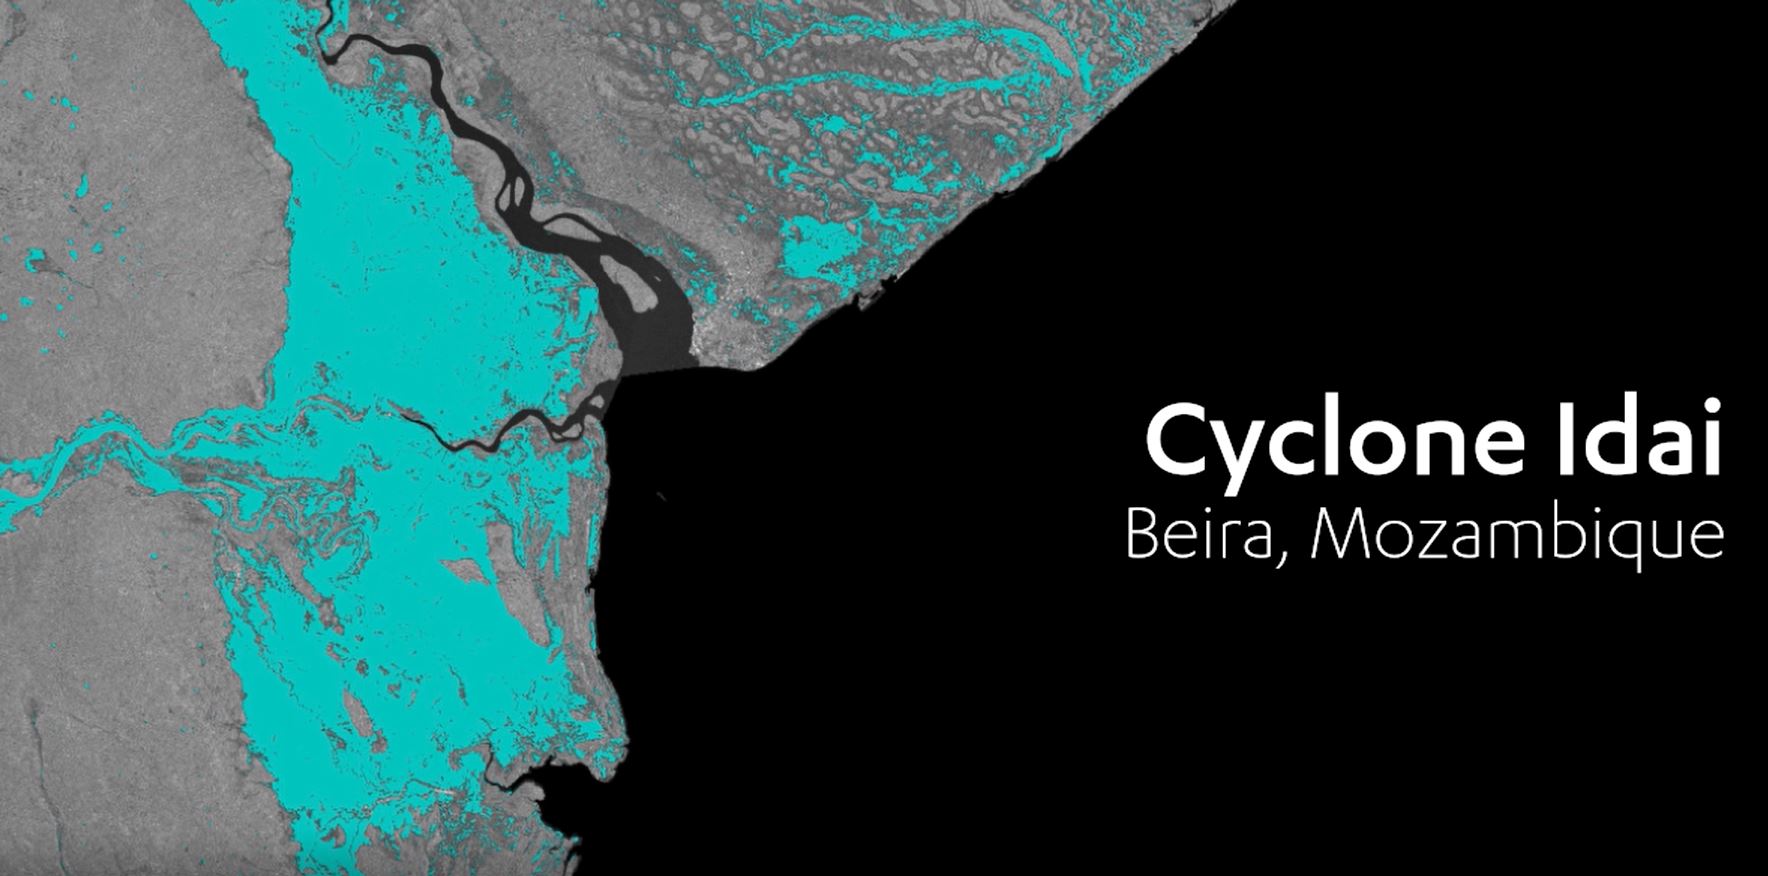
The devastating Idai cyclone and flood mapping from space:
21 march 2019
On March 14, the cyclone Idai made landfall on the coast of Mozambique, causing severe rainfall and widespread flooding throughout Mozambique, Malawi and Zimbabwe.
Synthetic Aperture Radar (SAR) images captured by the Sentinel-1 satellite can be used to accurately map the extent of flooding over large geographical areas, using advanced image analysis and processing.
Mozambique’s fourth largest city, Beira in the Sofala province, was one of the most severely affected areas.
By using SAR imagery, we have mapped the flooding’s caused by the cyclone around the city.
These maps are essential for informing authorities and development organizations about the geographical extent and impact from flooding events, in order to target emergency response and development efforts.
Contact us if you want access to the imagery in full resolution or if you are interested in hearing more about flood mapping from space.
As part of the ongoing support to the Zambezi Watercourse Commission (ZAMCOM) our project EO4SD Water has mapped the extent of recent floodings in Mozambique and Malawi, see link below.
Using remote sensing to map and characterize the coastal zone within the planned oil spill sensitivity atlas . . . .
Mapping the coastal zone in NE Greenland
Using remote sensing to map and characterize the coastal zone within the planned oil spill sensitivity atlas
Why is it important?
Remote and challenging regions, such as Northeast Greenland, are difficult to map in detail, and existing topographic maps in Greenland are usually inaccurate with undefined or undocumented features and characteristics.
This makes it difficult to create an Environmental Oil Spill Sensitivity Atlas for NE Greenland, which already exists for West and South Greenland. Such atlases require a topographic base map and information on the physical environment.
With freely and commercially available satellite imagery as well as advanced image analysis coupled with local knowledge it is possible to provide detailed characteristics of the coastal zone in the arctic waters without the safety risks associated with traditional survey methods and at a much more cost-efficient rate, resulting in reliable and objective data.
Project highlights:
Geological and morphological classification of the coastline in NE Greenland aiming to be included in an oil spill sensitivity atlas providing the foundation for a planning tool for when an emergency response is needed
Determining the intertidal zone in the area and calculating depth of shallow waters
All derived products made publicly available through a governmental spatial infrastructure platform
In more detail..
The project used remote sensing approaches to map and characterize the coastal zone within the planned oil spill sensitivity atlas which includes off-shore hydrocarbon areas of interest in NE Greenland.
Using new methods within satellite remote sensing data gives the possibility of providing updated products at a higher resolution in a timely manner.
This work will be highly complementary to the coarser scale but larger regional coverage of the planned atlas, which will be based on existing data. Both products will act as a validation tool for the other, and will also allow for the opportunity to examine advantages and limitations of the different approaches.
The demonstration mapping products have all been based on satellite information that would facilitate an upscaling of the mapping allowing to cover large and poorly mapped regions of the Arctic.
An important part of the existing oil spill sensitivity atlases is the analysis of the oil spill resistance of the coast. General coastal morphology and geology determines how oil spills will be absorbed by the materials along the coast or washed off. This is traditionally done by a manual assessment using available topographic maps and low resolution satellite images in segments of a few kilometers along the coast.
The new analyses would be beneficial to the atlas as it can detect straight or complex coastlines for the identification of risk of possible oil concentrations caught in pocket beaches or other complex morphologies. It can also determine geology types indicating where the oil would be absorbed or rejected and the new information about tidal zones would indicate where oil would be saturated.
The project has been conducted collaboratively with a team of experts from our partners Asiaq, GINR and DCE.