New satellite-based
information proves valuable for the onshore wind industry
We are now over a year into the exciting Innowind project funded by Innovation Fund Denmark with some very encouraging results on developing better land surface input for wind modelling with the aim to significantly lower current uncertainties for wind estimates.
At DHI GRAS, we have specifically focused on providing better land cover information and forest height estimates as input to surface roughness models.
Working with our project partners including industry professionals such as Vestas, Vattenfall and EMD International and researchers from the technical university, DTU Space and DTU Wind, is highly valued, as it allows us to streamline our research efforts into something of immediate value for the wind industry.
Our initial results are already showing the value of using satellite-derived data in wind modelling providing improved wind resource assessments.
Land cover as input to surface roughness estimates
One of the many key inputs to wind modelers is land cover information as different land cover types can have structural characteristics that affect the wind profile, i.e. forests are more rough than agricultural land etc.
The standard practice by wind modelers is to use generic land cover maps that are not well suited for wind modelling.
An example of this is the Corine land cover that is frequently used by the wind community. This land cover data set has over 40 classes, but most classes are irrelevant for wind modelers and a lot of work goes into merging classes to meaningful groups.
The scale of the land cover map (100m pixel resolution) is furthermore too coarse and although provides good information for regional planning, it often fails to provide finer spatial details required for microscale wind modelling.
Predicted forest height plotted against the observed forest height (validation data).
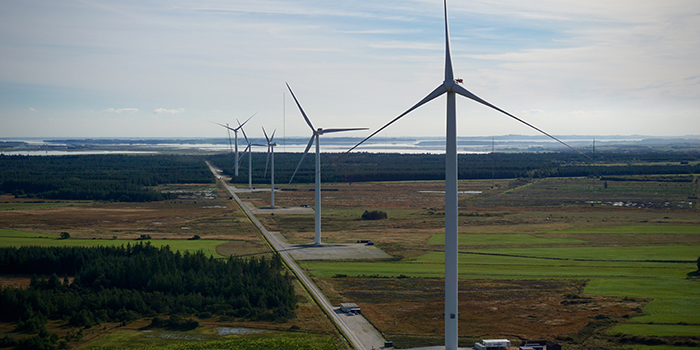
Land Cover classification can be done automatically with wind industry selected classes. Here illustrated on a Swedish wind farm site.
The classes are converted to Roughness lengths that are used as input in wind models improving wind energy assessments.
Lastly, the Corine data set is only updated every five years. During this time, deforestation and urbanization may have taken place, meaning wind models are often run using outdated land cover data, negatively affecting the models’ performance.
As near real-time satellite imagery and increased computational power are now available, it is about time that the wind industry evolves and improves the quality and resolution of the land cover maps used for wind resource assessments.
The results from a Swedish wind farm show how a few select classes can be converted into input to a surface roughness computation.
Working closely with the project partners, DHI GRAS has developed an automated land cover mapping application that estimates surface roughness via look-up tables (provided by DTU WIND). The model is globally available in 10 meter resolution.
Forest Height Modelling
Forest height remains poorly accounted for in the majority of wind simulations and relatively little literature is published on the effect of forest height on wind models.
It is, however, commonly acknowledged that forest height has a major impact on the wind-flow, and not accounting for this will influence wind simulations (we refer to our project partner Ebba Delwik for more information on the subject).
In Innowind, we do the first systematic review of this, and have developed a model to predict forest heights using satellite-based methods and freely available data sources, which are far more cost-efficient compared to traditional LIDAR campaigns. The model requires calibration/validation data of known forest heights, together with predictive variables derived from Sentinel and Landsat satellite sensors.
For forest height modelling, we tested several machine learning regression models. The models take the forest height calibration data and finds relationships between the known heights and the predicted variables from Sentinel and Landsat. The results showed that forest height can be estimated effectively using open source data.
We validated the results by comparing predicted forest height estimations with the validation dataset described above achieving a Mean Absolute Error (MAE) of about 2 meters, which is well within the acceptable range needed for improved wind flow modelling.
High-resolution image showing a forest at the Osterild site (left), and predicted forest heights derived from the Innowind project.The predicted forest heights agree with results from an in-situ campaign. The predicted forest heights agree with results from an in-situ campaign.
Model results and way forward
The wind industry is showing great interest in the novel data sets from DHI GRAS and it has been shown that using the new products improves the wind energy assessments.
The results will be presented at the upcoming workshop in Østerild, Denmark on March 27.
There are still a few open spots available if you want to join the workshop.
If not, we will share these results later in the year.
Until then, reach out to us if you want to know more or want to test the data in your wind models.
Predicted forest height for macro scale modelling data. The models can be upscaled in more coarse resolution for mesoscale wind modelling.
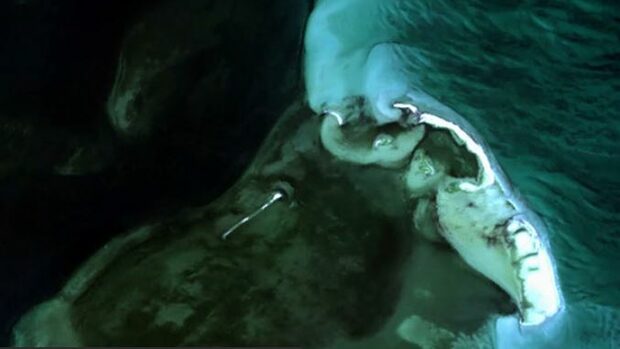
The Danish Ministry of Environment and Food has announced that since 2015, 11 new small islands have been created in Denmark.
The Danish landscape is a relic of the Ice Age, furnished with sand and clay materials, that get pushed around by ocean currents and deposited along the coast. When enough material is collected in one place, a shallow island appears and can over time grow in size, creating ideal breeding grounds for birds due to their isolated location.
The biggest of the new islands, consisting of 36 hectares of mostly sand, is found near Sækkesand, north of the island of Møn, and is already inhabited by the rare Caspian tern and other sea and wading birds.
The birds, however, should not get too comfortable as these islands might be swept away by a large storm or slowly eroded over time. This is part of the natural dynamic nature of the coastal zone.
Satellite-based monitoring of the dynamic coastal zone is one of our core competences, and with data from the Sentinel satellites we can map these changes in detail on a large scale.
The video below documents the development of the new island between 2015 and 2018 - another great example of the usefulness of the free and open Copernicus data.
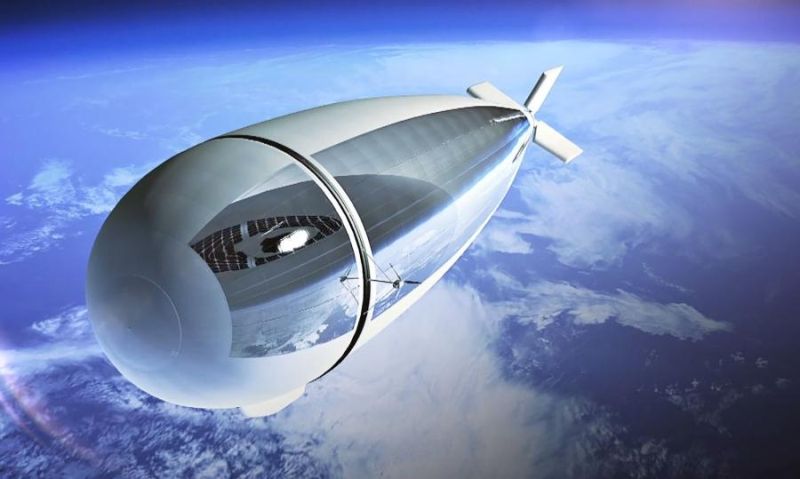
Exploring service provision opportunities and evaluating payload maturity for HAPS platforms . . . .
Combining satellites with High Altitude Pseudo Satellites (HAPS)
Exploring service opportunities and evaluating payload maturity for HAPS platforms
Why is it important?
As a future technology, HAPS platforms will open a new market for remote sensing and surveillance. It offers disruptive and complementary applications to services enabled by satellites, terrestrial infrastructures and Remotely Piloted Aircraft Systems (RPAS), at relatively low cost.
Project highlights:
Providing detailed analysis of existing technology gaps and service limitations for maritime activities.
Identification of system and performance requirements to explore payload components and infrastructure conforming to the requirements of the target user community
Extensive review of earth observation sensors to define a payload package consistent with user and platform specific requirements
In more detail..
Still in the early stage of development, production and operation, High Altitude Pseudo Satellites (HAPS) offers the potential to open a new market for remote sensing and surveillance in the future. HAPS operates at an altitude of approximately 20 km and can observe locations over extended time periods. This enables time critical and continuous monitoring and surveillance over specific areas of interest at relatively low cost.
In the ESA funded project ‘services enabled by HAPS complemented by satellites’, DHI GRAS explores the feasibility and capability of HAPS enabled services to extend the capabilities of satellites and Remotely Piloted Aircraft Systems (RPAS) in the domain of Earth Observation. The main objective is to propose potential services for HAPS that exploit the characteristics of the individual platforms and evaluate the maturity of payload technologies necessary to facilitate service provision.
Through an extensive stakeholder engagement process with potential end-users of HAPS enabled services within maritime operations and surveillance, we established a baseline for a system service definition and payload configuration that addresses the primary technology gaps and service limitations within target user communities. Through this analysis the client gained critical insight into the potential uptake and viability of services enabled by HAPS platforms.
This week DHI GRAS has been meeting with Marc Paganini from European Space Agency - ESA (ESRIN) and our partners Geoville, UNEP-WCMC and DHI-UNEP to discuss how the EO for SDGs project has been progressing.
The aim of the project is to maximise the contribution of EO data to the SDG agenda by producing targeted high-quality indicator monitoring guidelines and effective outreach material, and by showcasing the usability of EO data in country demonstration studies and in dialogues with UN stakeholders.
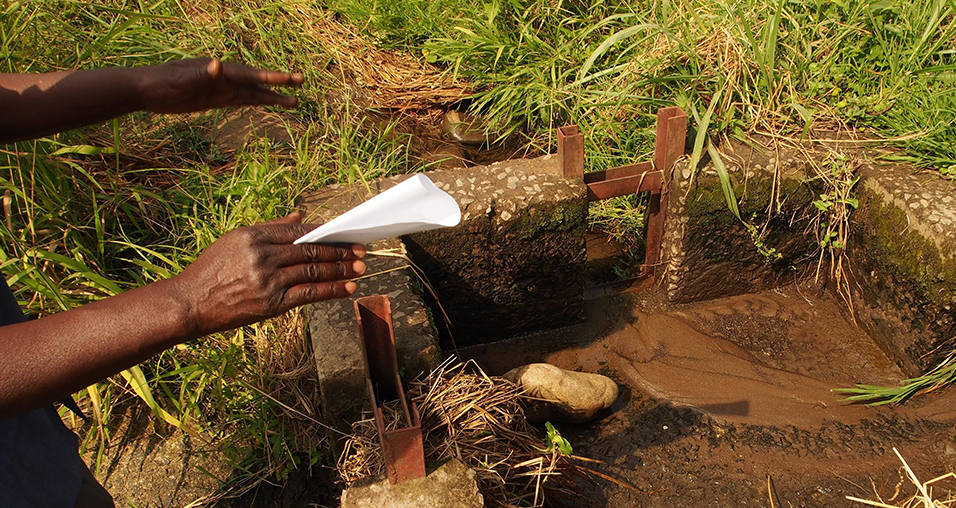
As a follow up, DHI GRAS and ESA also visited FAO for discussions on how EO can contribute to the reporting on SDG indicator “6.4.1 Change in Water Use Efficiency over time”, which is one of the two SDG indicators that are part of the National test case for Uganda.
One main outcome has been a Policy Brief describing how EO can contribute to improvements of the SDG monitoring framework under Agenda 2030 addressed to policy makers, national statistics offices and other SDG agencies. The Policy Brief highlights 17 SDG indicators for which EO has a definite contribution.
The Policy Brief is expected to be released in April.
Preparing for the future of the Common Agricultural Policy:
An example of satellite-based catch crop monitoring in Denmark
Growing catch crops after main crops is considered an important management practice for the resilience and long-term stability of agricultural cropping practices. Catch crops are non-profit crops planted a few weeks after the harvest of the main crop and before the next one is sown. This practice imitates the natural ecosystem by preserving soil nutrient resources such as nitrogen and phosphorous, increasing soil fertility and carbon sequestration, and reducing soil erosion.
In Europe, catch crops are part of the second pillar of the Common Agricultural Policy (CAP), an agricultural subsidy system for farmers, where farmlands of more than 15 hectares generally have to designate 5% of the arable land as “ecological focus areas” in order to comply with the provision. Growing catch crops such as fodder radish, yellow mustard and different grasses are one way to live up to this requirement.
EU regulations provides rules for the financing of CAP expenditure and for relevant management and control systems, requiring Member States to put an integrated administration and control system in place for the management of most of the EU agricultural spending. In Denmark, this is managed by the Danish Agricultural Agency (DAA), whose work involves many field-based controls and heavy administrative burdens.
Agricultural monitoring using satellite-based information serves as an efficient supplement to monitoring efforts performed by national agencies. At DHI GRAS, we have completed several projects for the DAA with promising results.
Our latest study focused on catch crop monitoring and maize harvest detection
One of the major challenges to large area monitoring using satellite imagery is that the data is highly irregular in time. For example, any two fields in Denmark will have very
different imagery available, due to different orbit overpass times over each field, and because of
gaps caused by cloud cover. To solve this challenge, we developed innovative processing techniques so that all available cloud-free imagery over Denmark can be used seamlessly in machine learning algorithms that can accurately map catch crops.
We tested a number of advanced machine learning and deep learning methods to optimize processing time and mapping accuracy – gathering valuable knowledge of current technological capabilities and which areas require further methodological development.
We’ve found great potential in using satellite imagery in connection with the agricultural industry especially for farmers, who can look forward to less paperwork and fewer control visits by the DAA.
Although information from satellites cannot completely replace field visits, it can be used to indicate to the DAA where they should focus their field visits.
By using satellites, we are taking a natural step towards the future of agricultural monitoring and are making the first experiences which over time will make it easier to live up to CAP regulations, both as a farmer and as a national agency.
AI4WATER - National Geographic Society and Microsoft Grant
Satellite-based evapotranspiration for improved crop water efficiency in Uganda.
Why is it important?
In Uganda, irrigation development contributes to food security, poverty alleviation and economic growth by using water sustainably.
Satellite remote sensing of evapotranspiration (ET) is an essential part of global observation systems. It provides inputs for agriculture, water resources management, weather forecasts, climate studies and many other applications. Easy access to reliable estimations of ET is a key requirement within these domains. When ET is successfully estimated at high resolution it can map crop water stress at field scale.
Project highlights:
Developing and implementing an open-source AI algorithm that merges optical, thermal and meteorological data.
The ability to get information on water stress levels for farms in Uganda. Due to the resolution, we can provide evapotranspiration information at farm level
Better insights can lead to 30% less water use for the same yield.
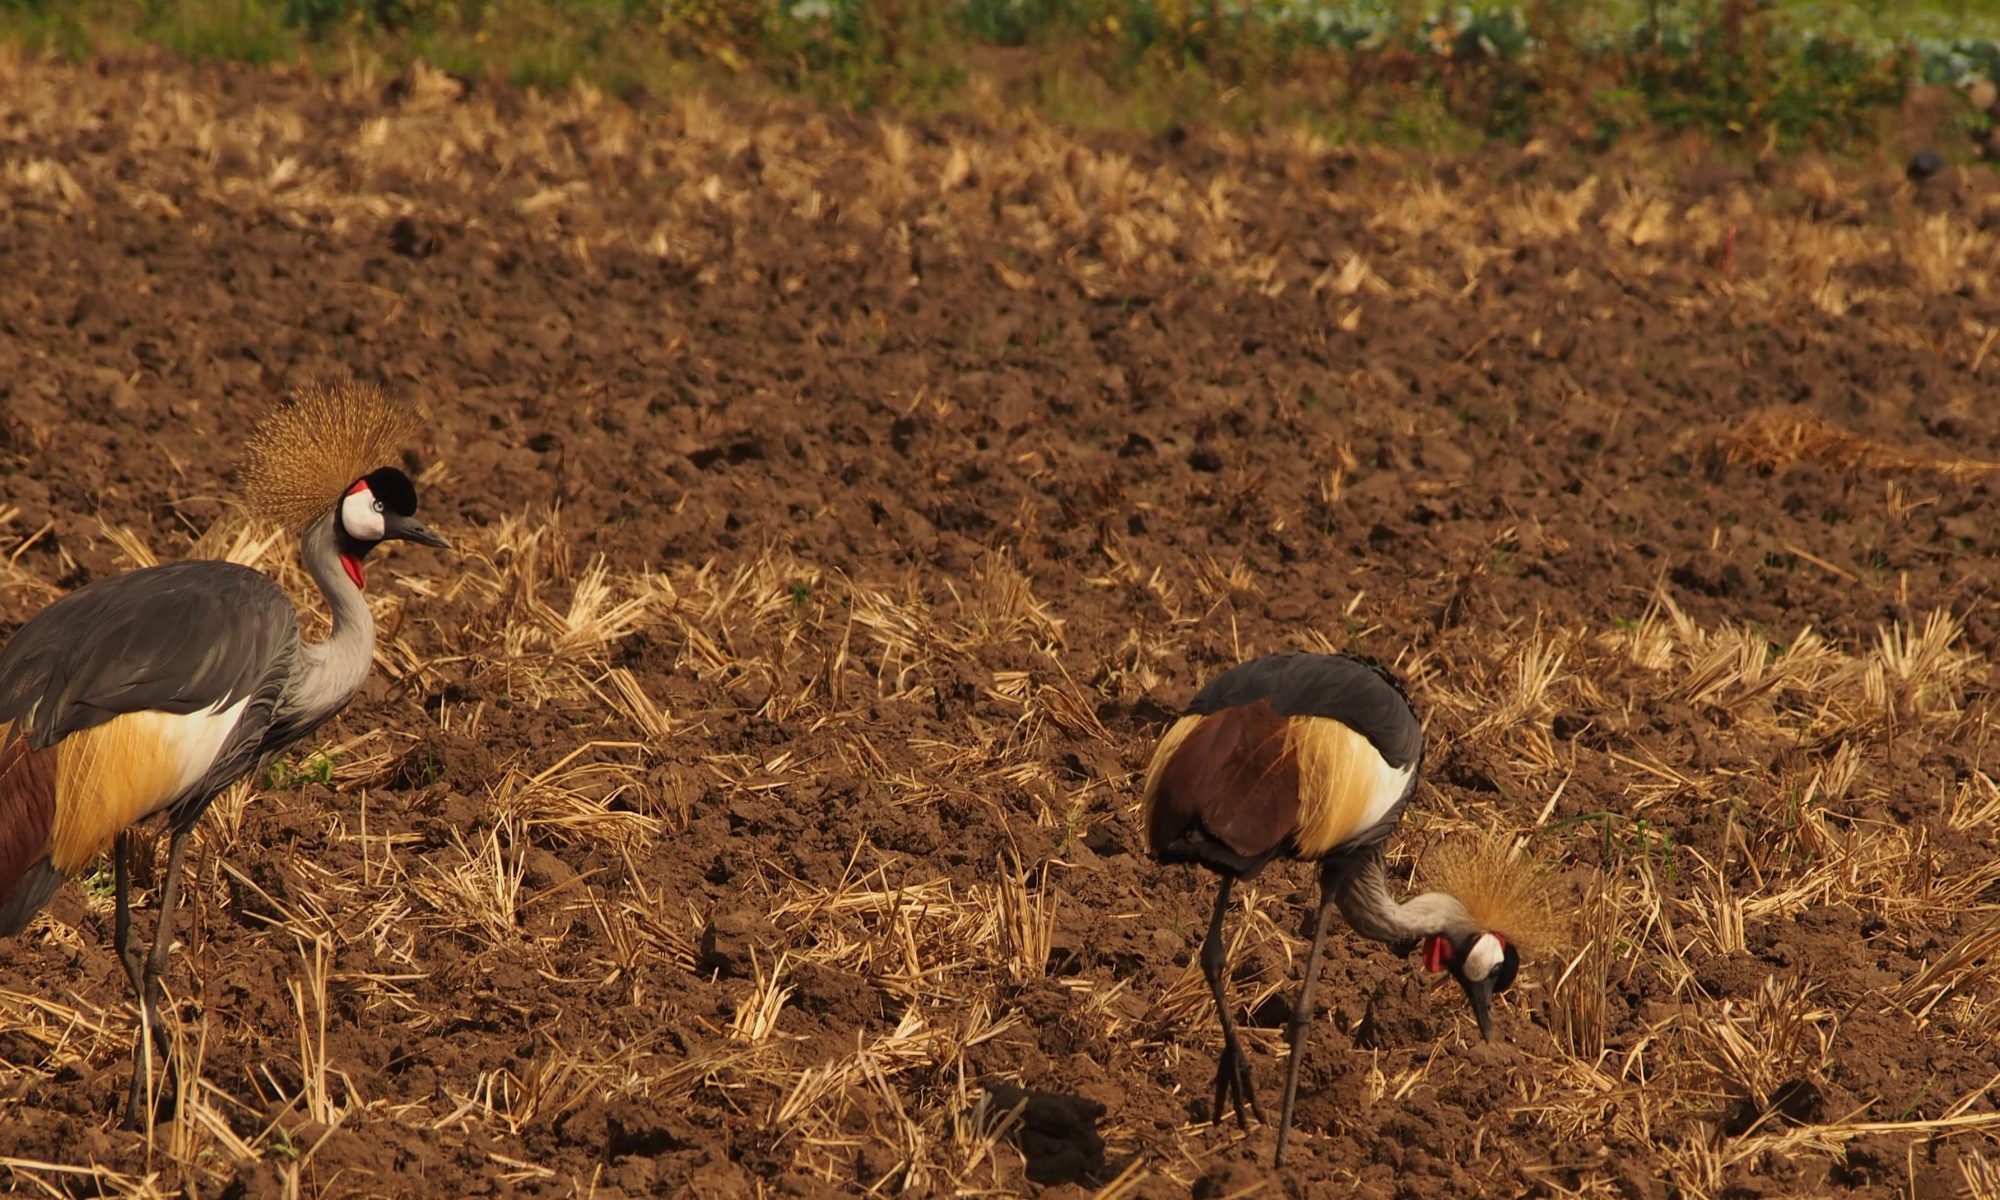
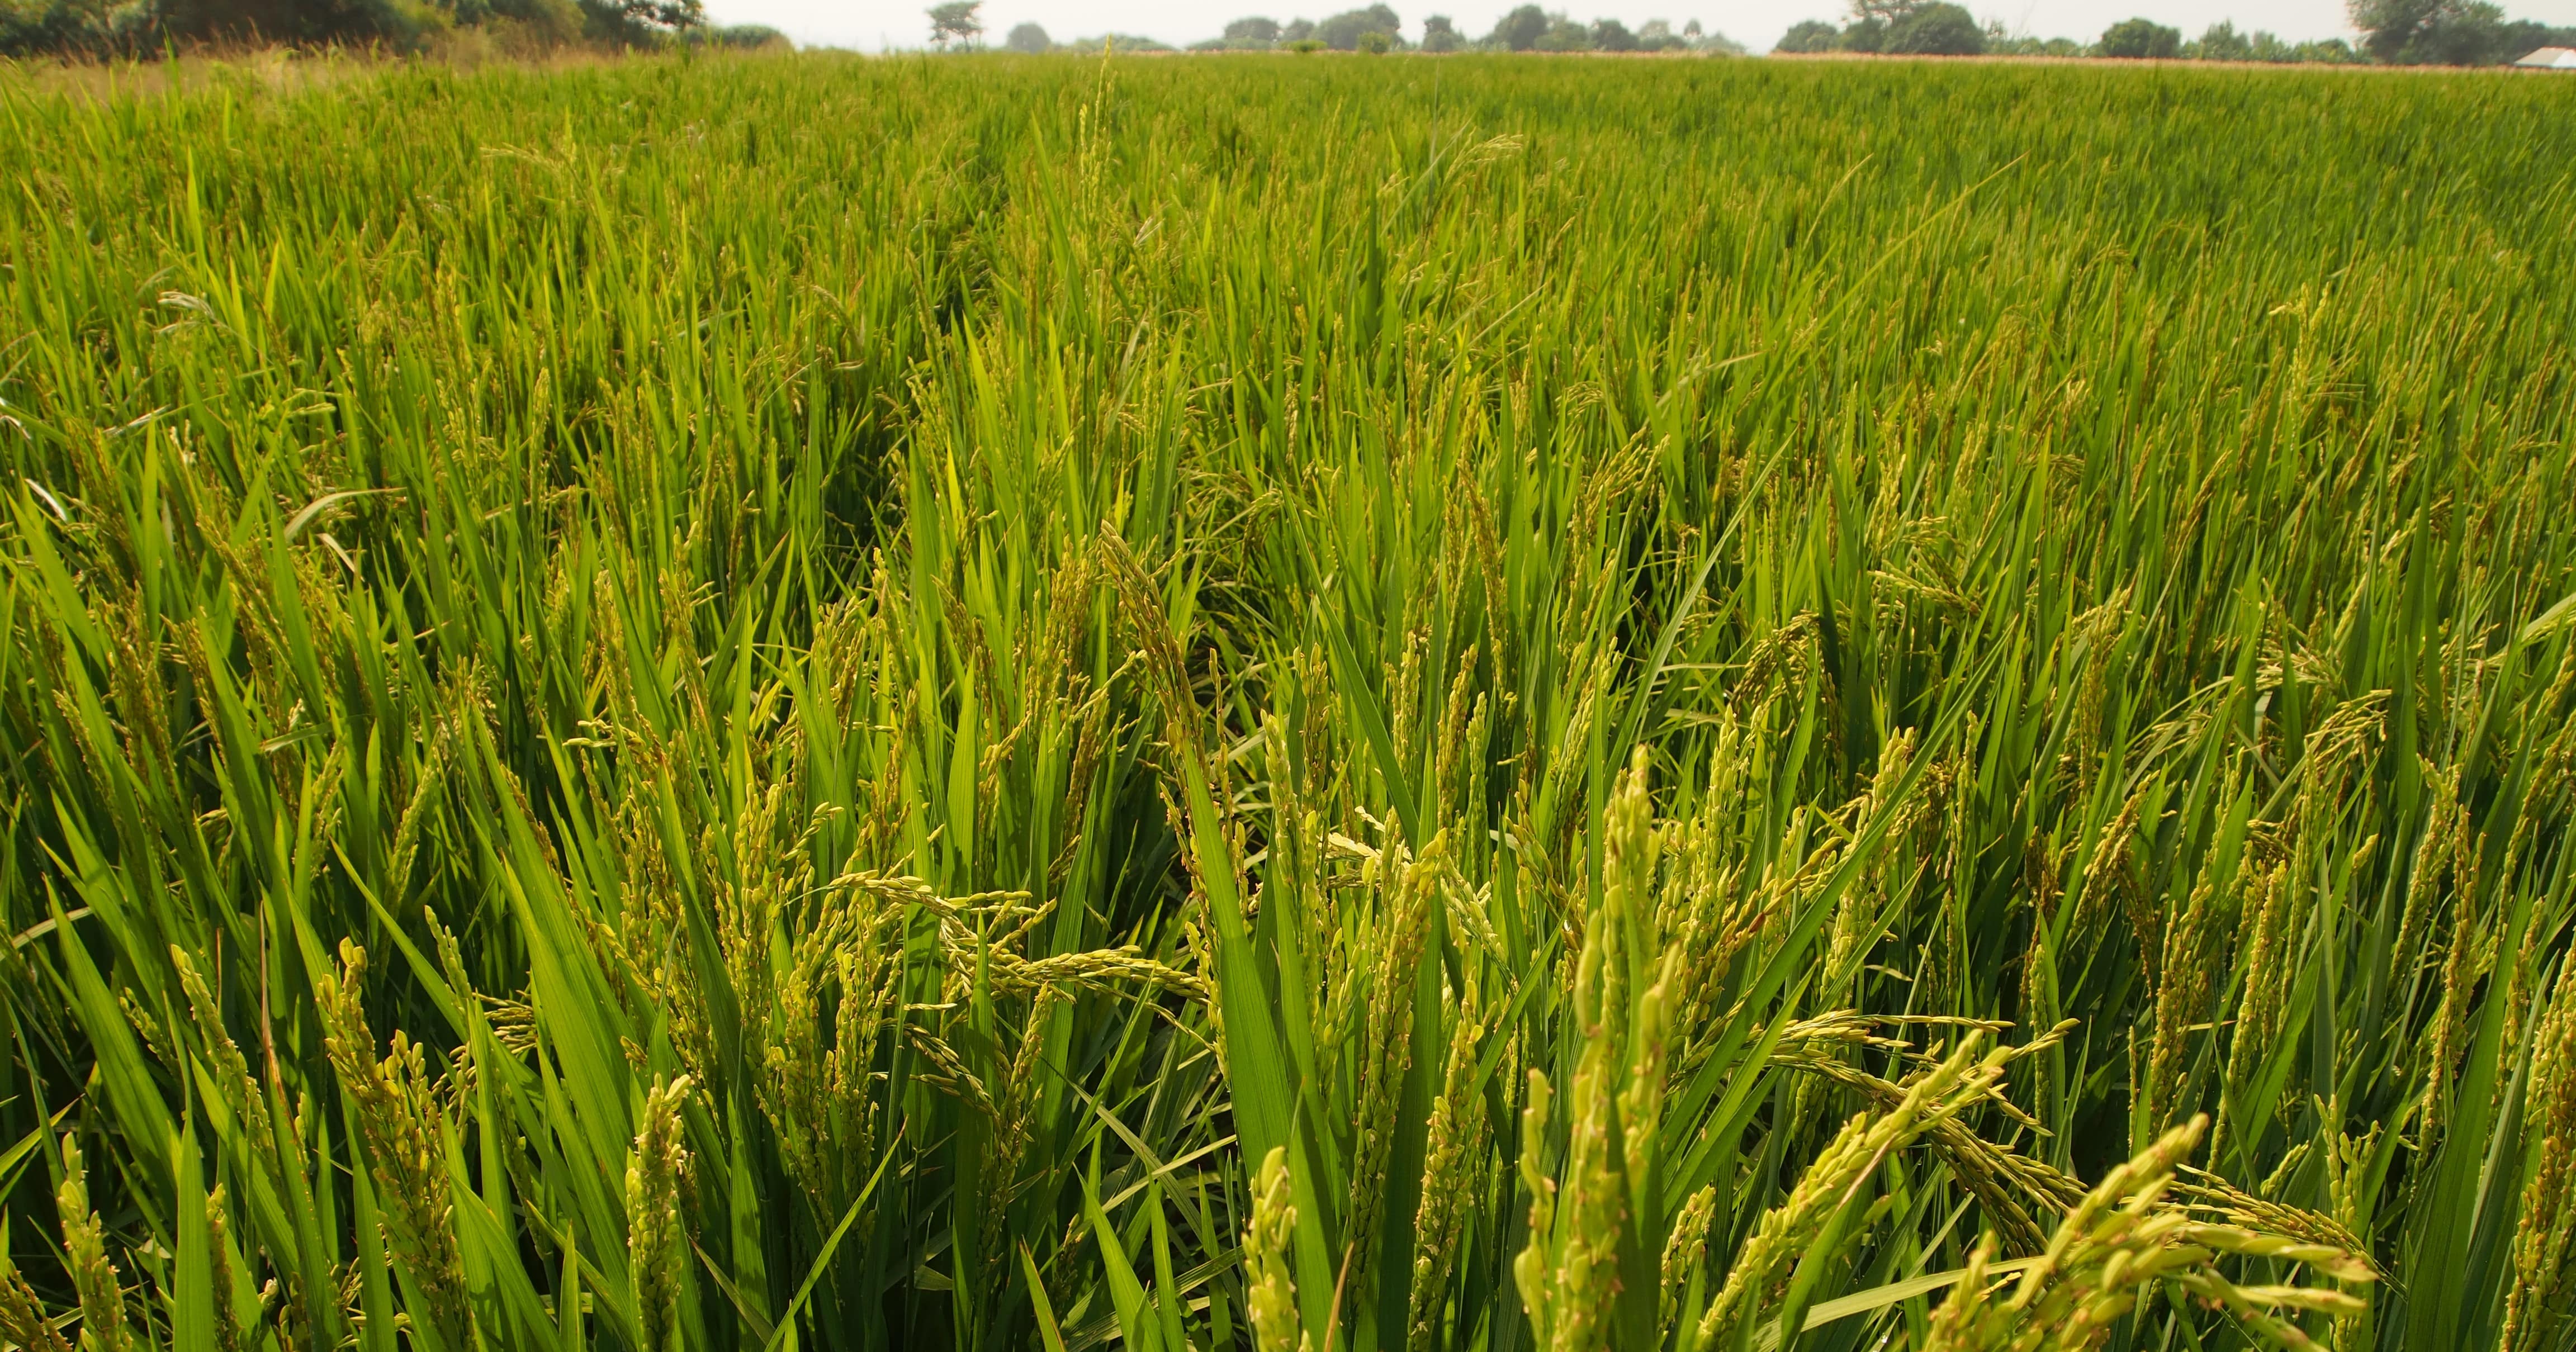
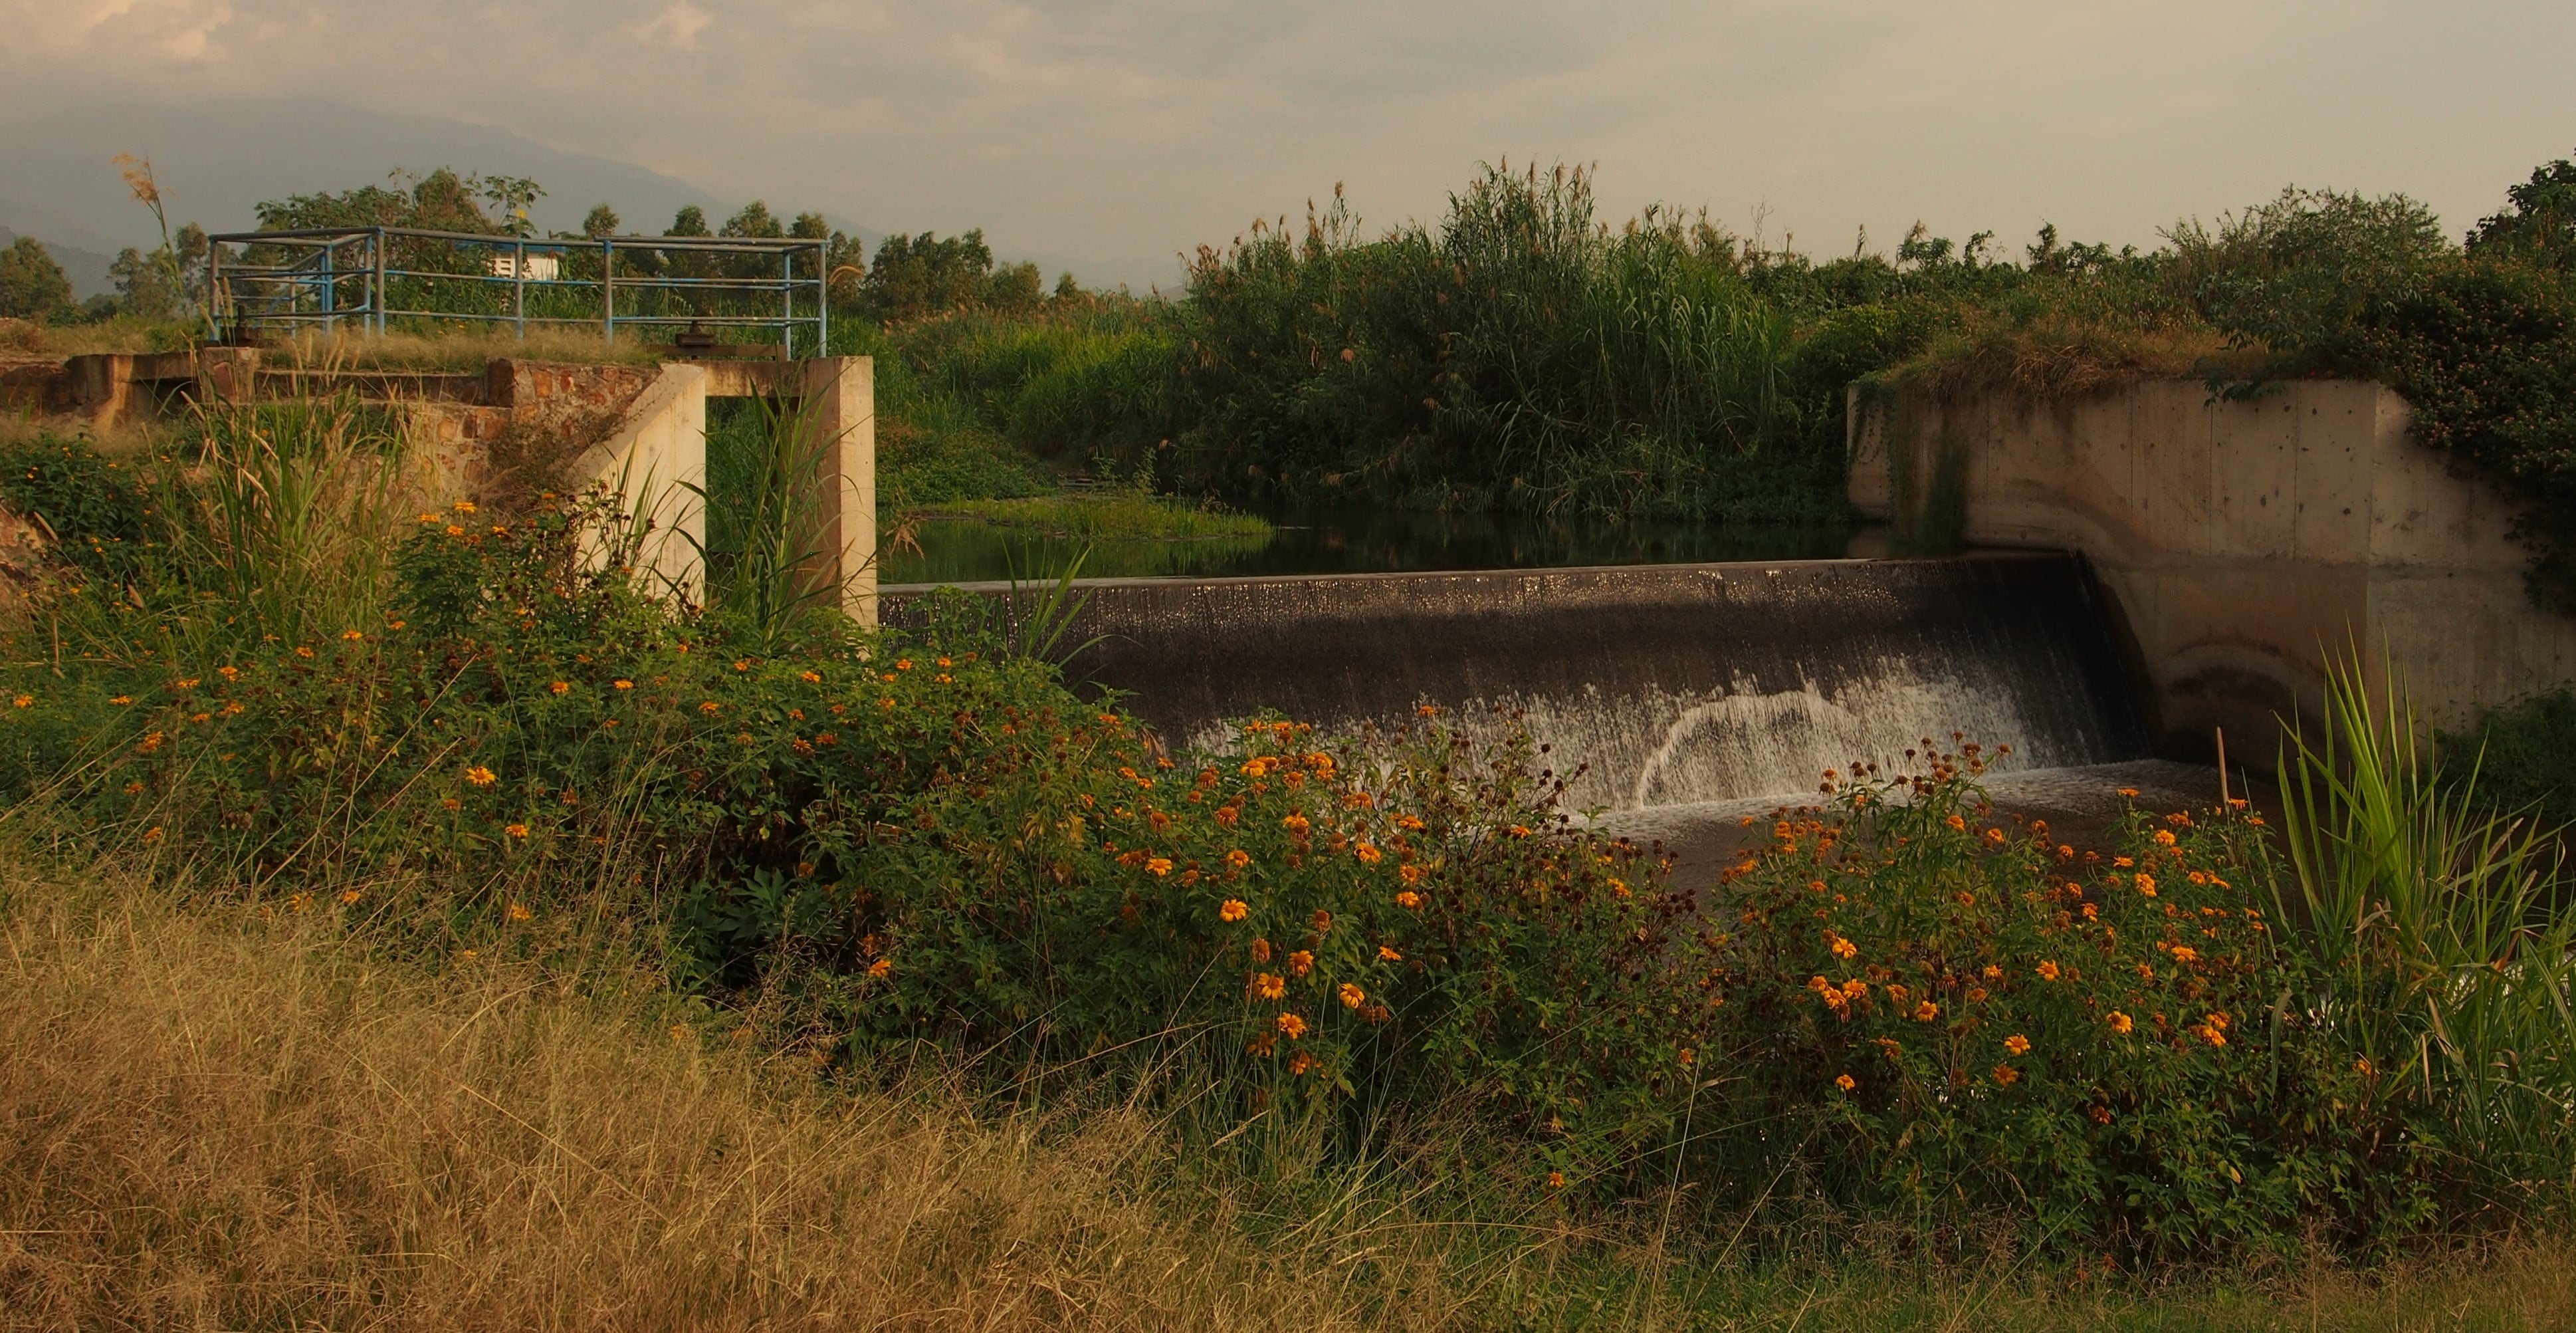
Mubuku, Western Uganda
The area holds close to 2000 hectares of smallholder farms watered by drainage channels
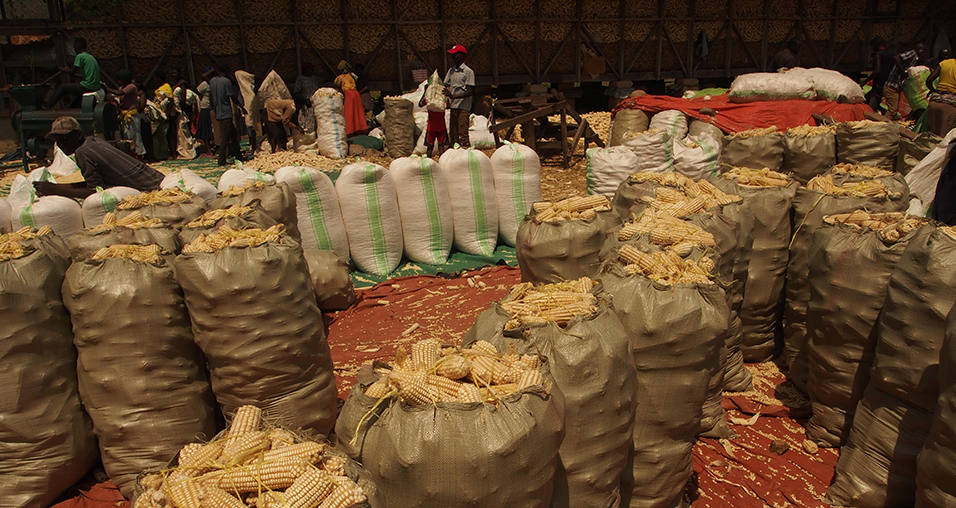
The main crops grown are maize, rice, onions and mangos
The purpose is to find out if crops are overwatered or under stress
In more detail..
This project aims to develop and roll-out a novel algorithm for obtaining evapotranspiration and crop water stress at farm level for a large national irrigation scheme in Uganda.
The site chosen for this project is Mubuku in the Kasese District.
It is expected that the project can lead to 30% less water use for the same yield, which would greatly benefit the local community and farmers.
Since the code will be open source the project can pave the way for better irrigation in drought prone countries.
The project is done in collaboration with our partners, the Ugandan geo-information company, Geo Gecko.
Microsoft and National Geographic AI for Earth Innovation Grant:
A new, joint grant program that will challenge environmental issues of the 21st century with the most advanced technologies available today.
“AI for Earth Innovation” grants will fund new solutions that leverage AI and cloud technologies to monitor, model and manage Earth’s natural resources.
Preparing for the future of the Common Agricultural Policy :
06 February 2019
An example of satellite-based catch crop monitoring in Denmark
Growing catch crops after main crops is considered an important management practice for the resilience and long-term stability of agricultural cropping practices. Catch crops are non-profit crops planted a few weeks after the harvest of the main crop and before the next one is sown. This practice imitates the natural ecosystem by preserving soil nutrient resources such as nitrogen and phosphorous, increasing soil fertility and carbon sequestration, and reducing soil erosion.
In Europe, catch crops are part of the second pillar of the Common Agricultural Policy (CAP), an agricultural subsidy system for farmers, where farmlands of more than 15 hectares generally have to designate 5% of the arable land as “ecological focus areas” in order to comply with the provision. Growing catch crops such as fodder radish, yellow mustard and different grasses are one way to live up to this requirement.
EU regulations provides rules for the financing of CAP expenditure and for relevant management and control systems, requiring Member States to put an integrated administration and control system in place for the management of most of the EU agricultural spending. In Denmark, this is managed by the Danish Agricultural Agency (DAA), whose work involves many field-based controls and heavy administrative burdens.
Agricultural monitoring using satellite-based information serves as an efficient supplement to monitoring efforts performed by national agencies. At DHI GRAS, we have completed several projects for the DAA with promising results.
Our latest study focused on catch crop monitoring and maize harvest detection
One of the major challenges to large area monitoring using satellite imagery is that
the data is highly irregular in time. For example, any two fields in Denmark will have very
different imagery available, due to different orbit overpass times over each field, and because of
gaps caused by cloud cover. To solve this challenge, we developed innovative processing techniques so that all available cloud-free imagery over Denmark can be used seamlessly in machine learning algorithms that can accurately map catch crops.
We tested a number of advanced machine learning and deep learning methods to optimize processing time and mapping accuracy – gathering valuable knowledge of current technological capabilities and which areas require further methodological development.
We’ve found great potential in using satellite imagery in connection with the agricultural industry especially for farmers, who can look forward to less paperwork and fewer control visits by the DAA.
Although information from satellites cannot completely replace field visits, it can be used to indicate to the DAA where they should focus their field visits.
By using satellites, we are taking a natural step towards the future of agricultural monitoring and are making the first experiences which over time will make it easier to live up to CAP regulations, both as a farmer and as a national agency.
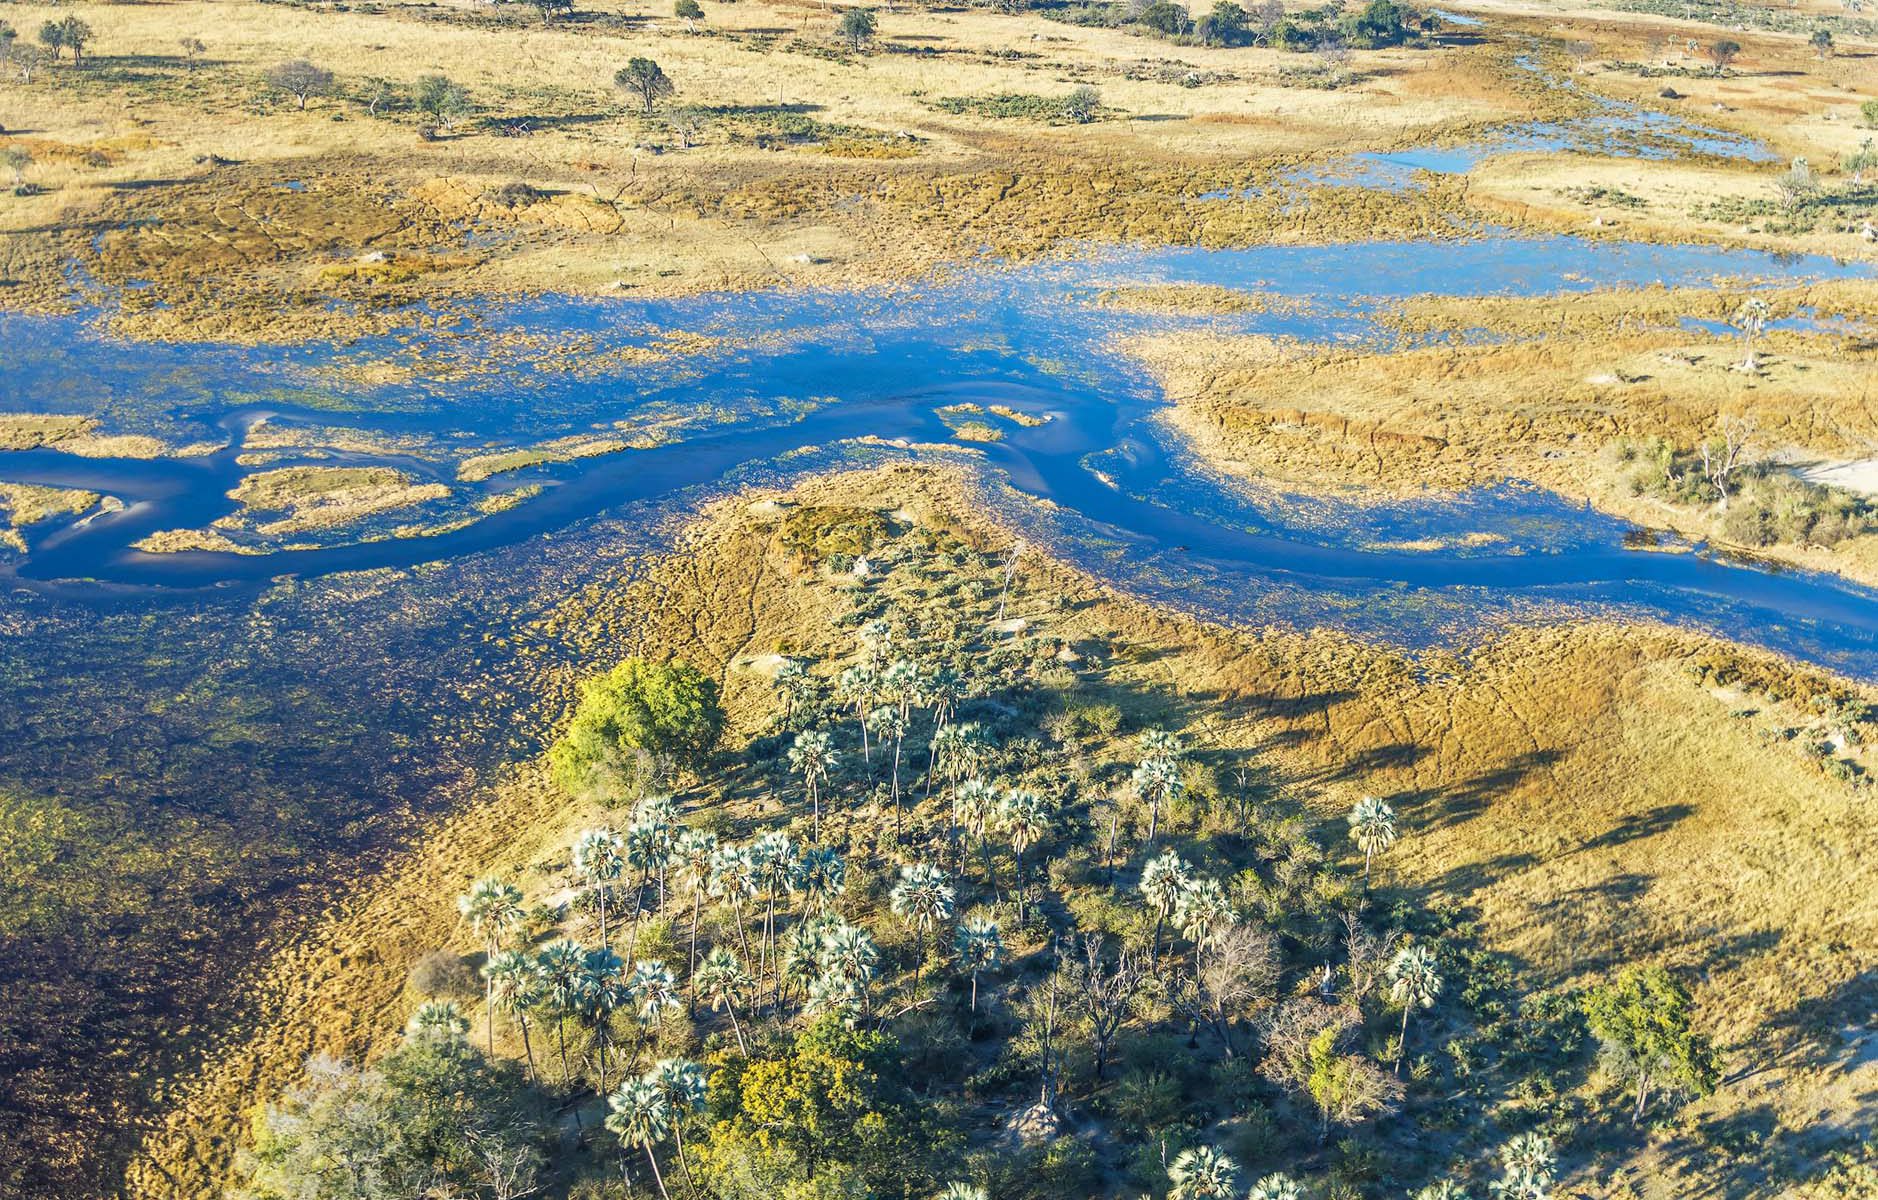
In celebration of World Wetlands Day on the 2nd of February 2019, and in recognition of the important role of wetlands in mitigation and adaptation to climate change, GlobWetland Africa is proud to announce the publication of several use cases on our new web viewer.
For all wetlands there is a relation to climate change. Water levels are critical to wetlands so changes in climatic conditions (e.g. the nature and variability of the wet and dry seasons, and the number and severity of extreme events) will highly influence wetland structure and functioning. But wetlands are also exposed to non-climatic anthropogenic impacts which can be amplified by climate change (e.g. drainage, water withdrawal, eutrophication, etc.).
Climatic and non-climatic drivers act synergistically causing wetland changes that can be difficult or impossible to reverse.
Better information on wetland status and trends are paramount to preserve and reverse the ongoing loss of wetlands. GlobWetland Africa can assist wetland managers and practitioners with Earth Observation data, tools and information that is needed to make informed decision for wetland conservation and restoration.
Check out the visualizations of selected use case stories here.
The powerful combination of AI and Earth Observation Data:
01 February 2019
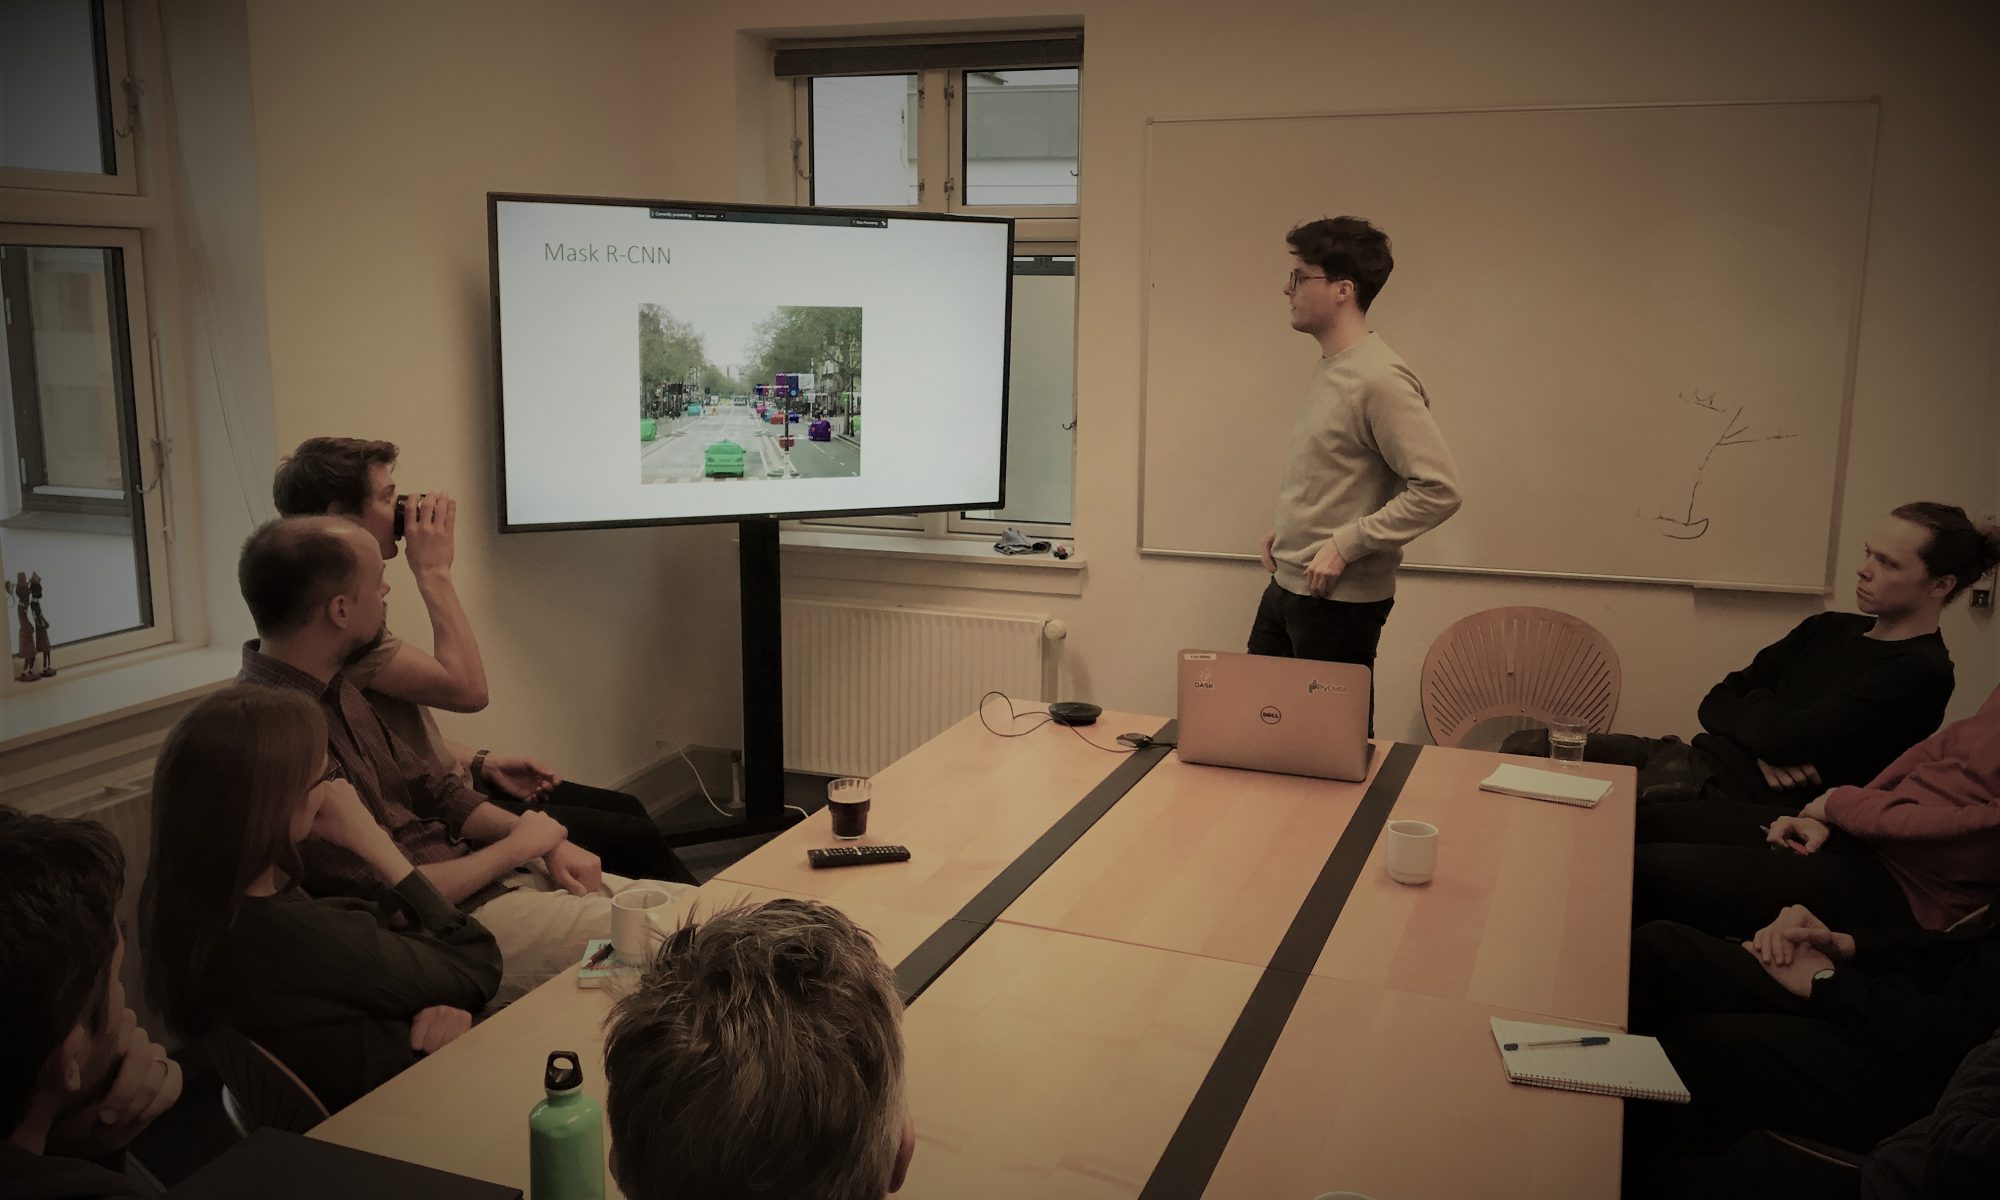
At DHI GRAS we routinely conduct coffee talks, where our experts present their latest research and development within advanced image analytics, data science or other trends within Earth Observation.
This week our AI expert Philip Graae demonstrated results of applying Deep Learning on Earth Observation Data.
By using principles of transfer learning, we have trained a state-of-the-art object detection neural network to detect and segment small and very detailed objects within earth observation image data.
With proper tuning and by using techniques such as data augmentation, it is possible to get good results with just a small amount of training data as input to the AI.
We rely on such deep learning techniques when traditional image analytics is not sufficient to extract the information from the imagery.
Worldwide high resolution flood risk and hazard mapping using historical and near real time satellite radar images and digital elevation models . .
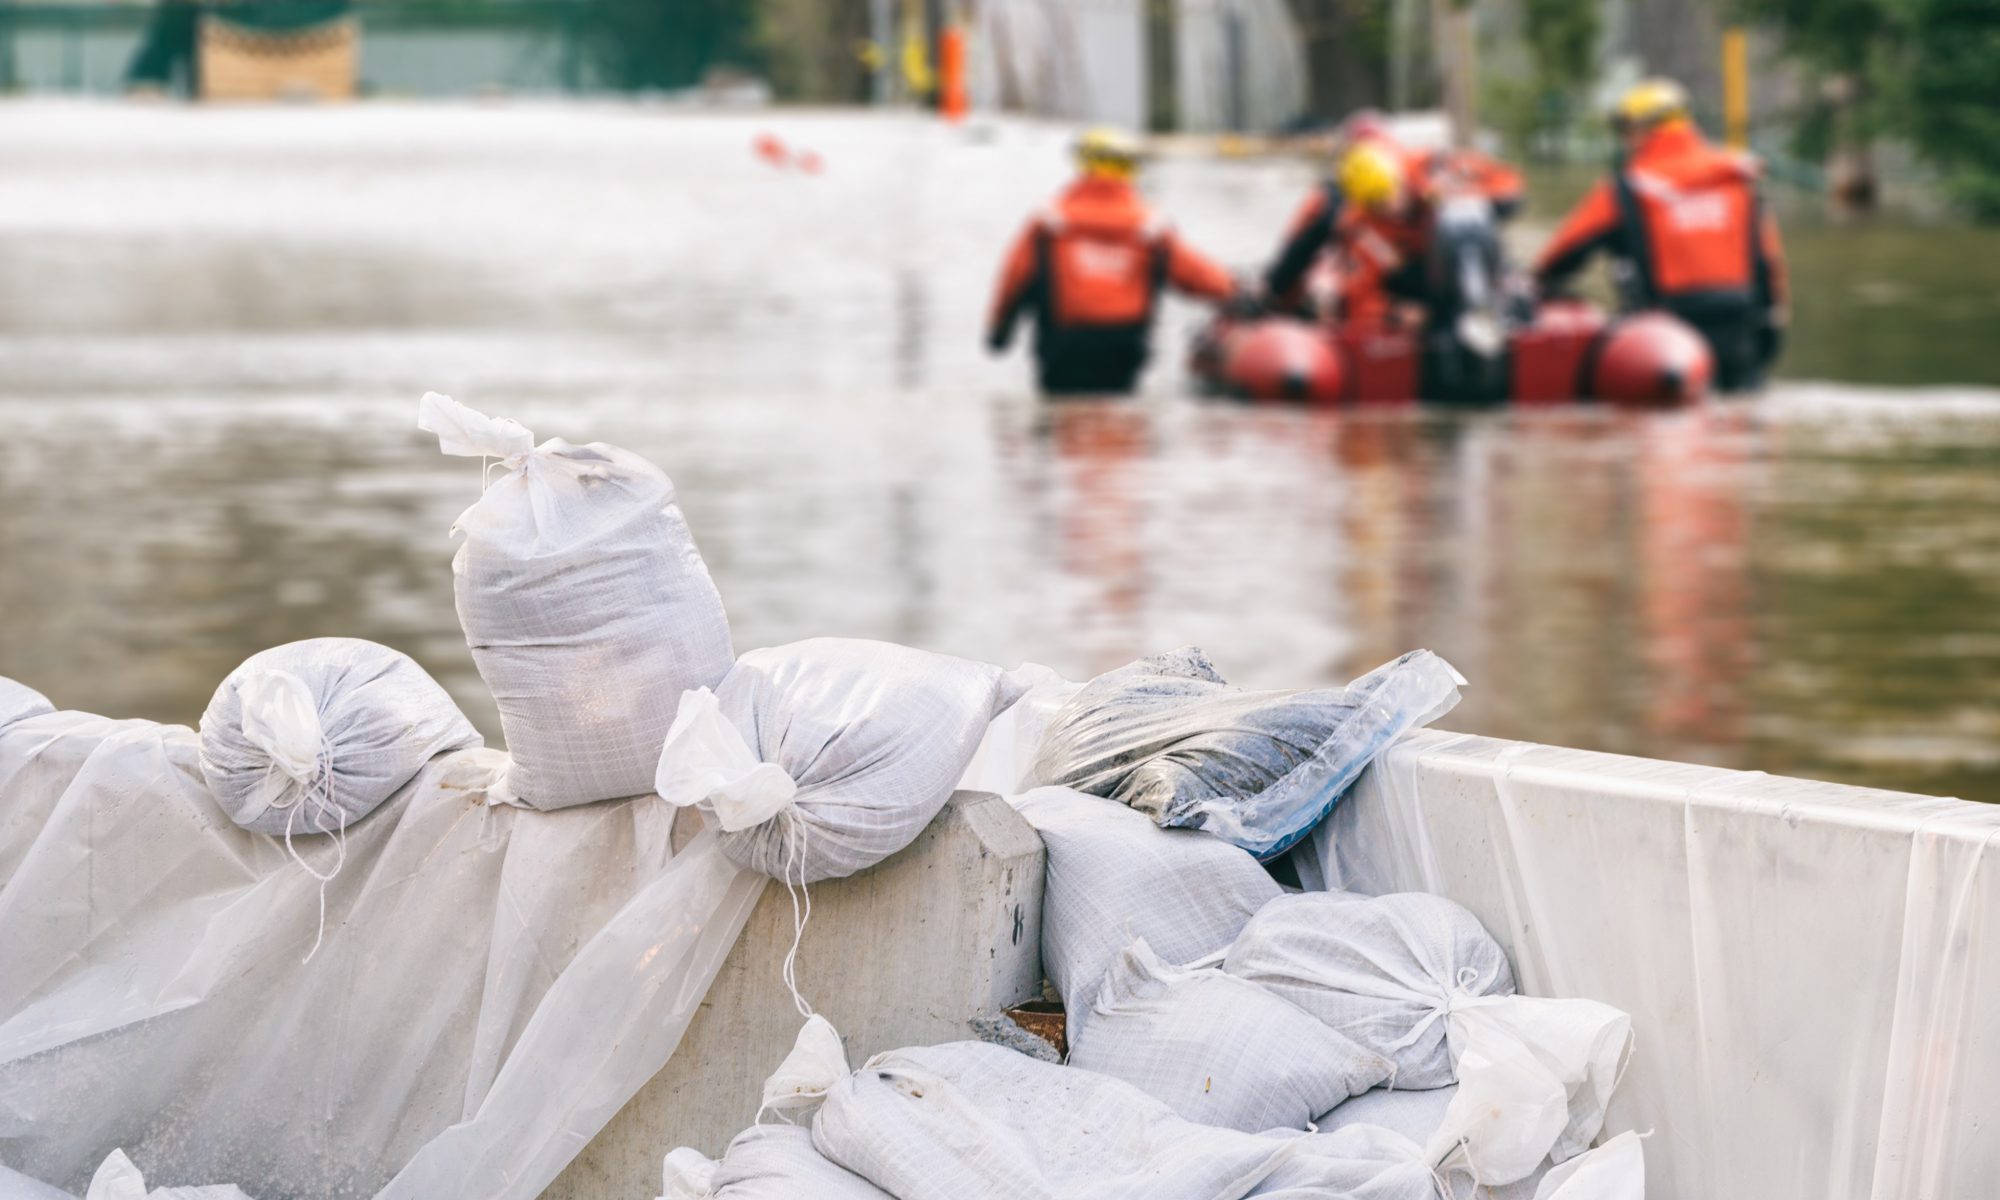
Flood and Hazard Mapping
Worldwide high resolution flood risk and hazard mapping
Why is it important?
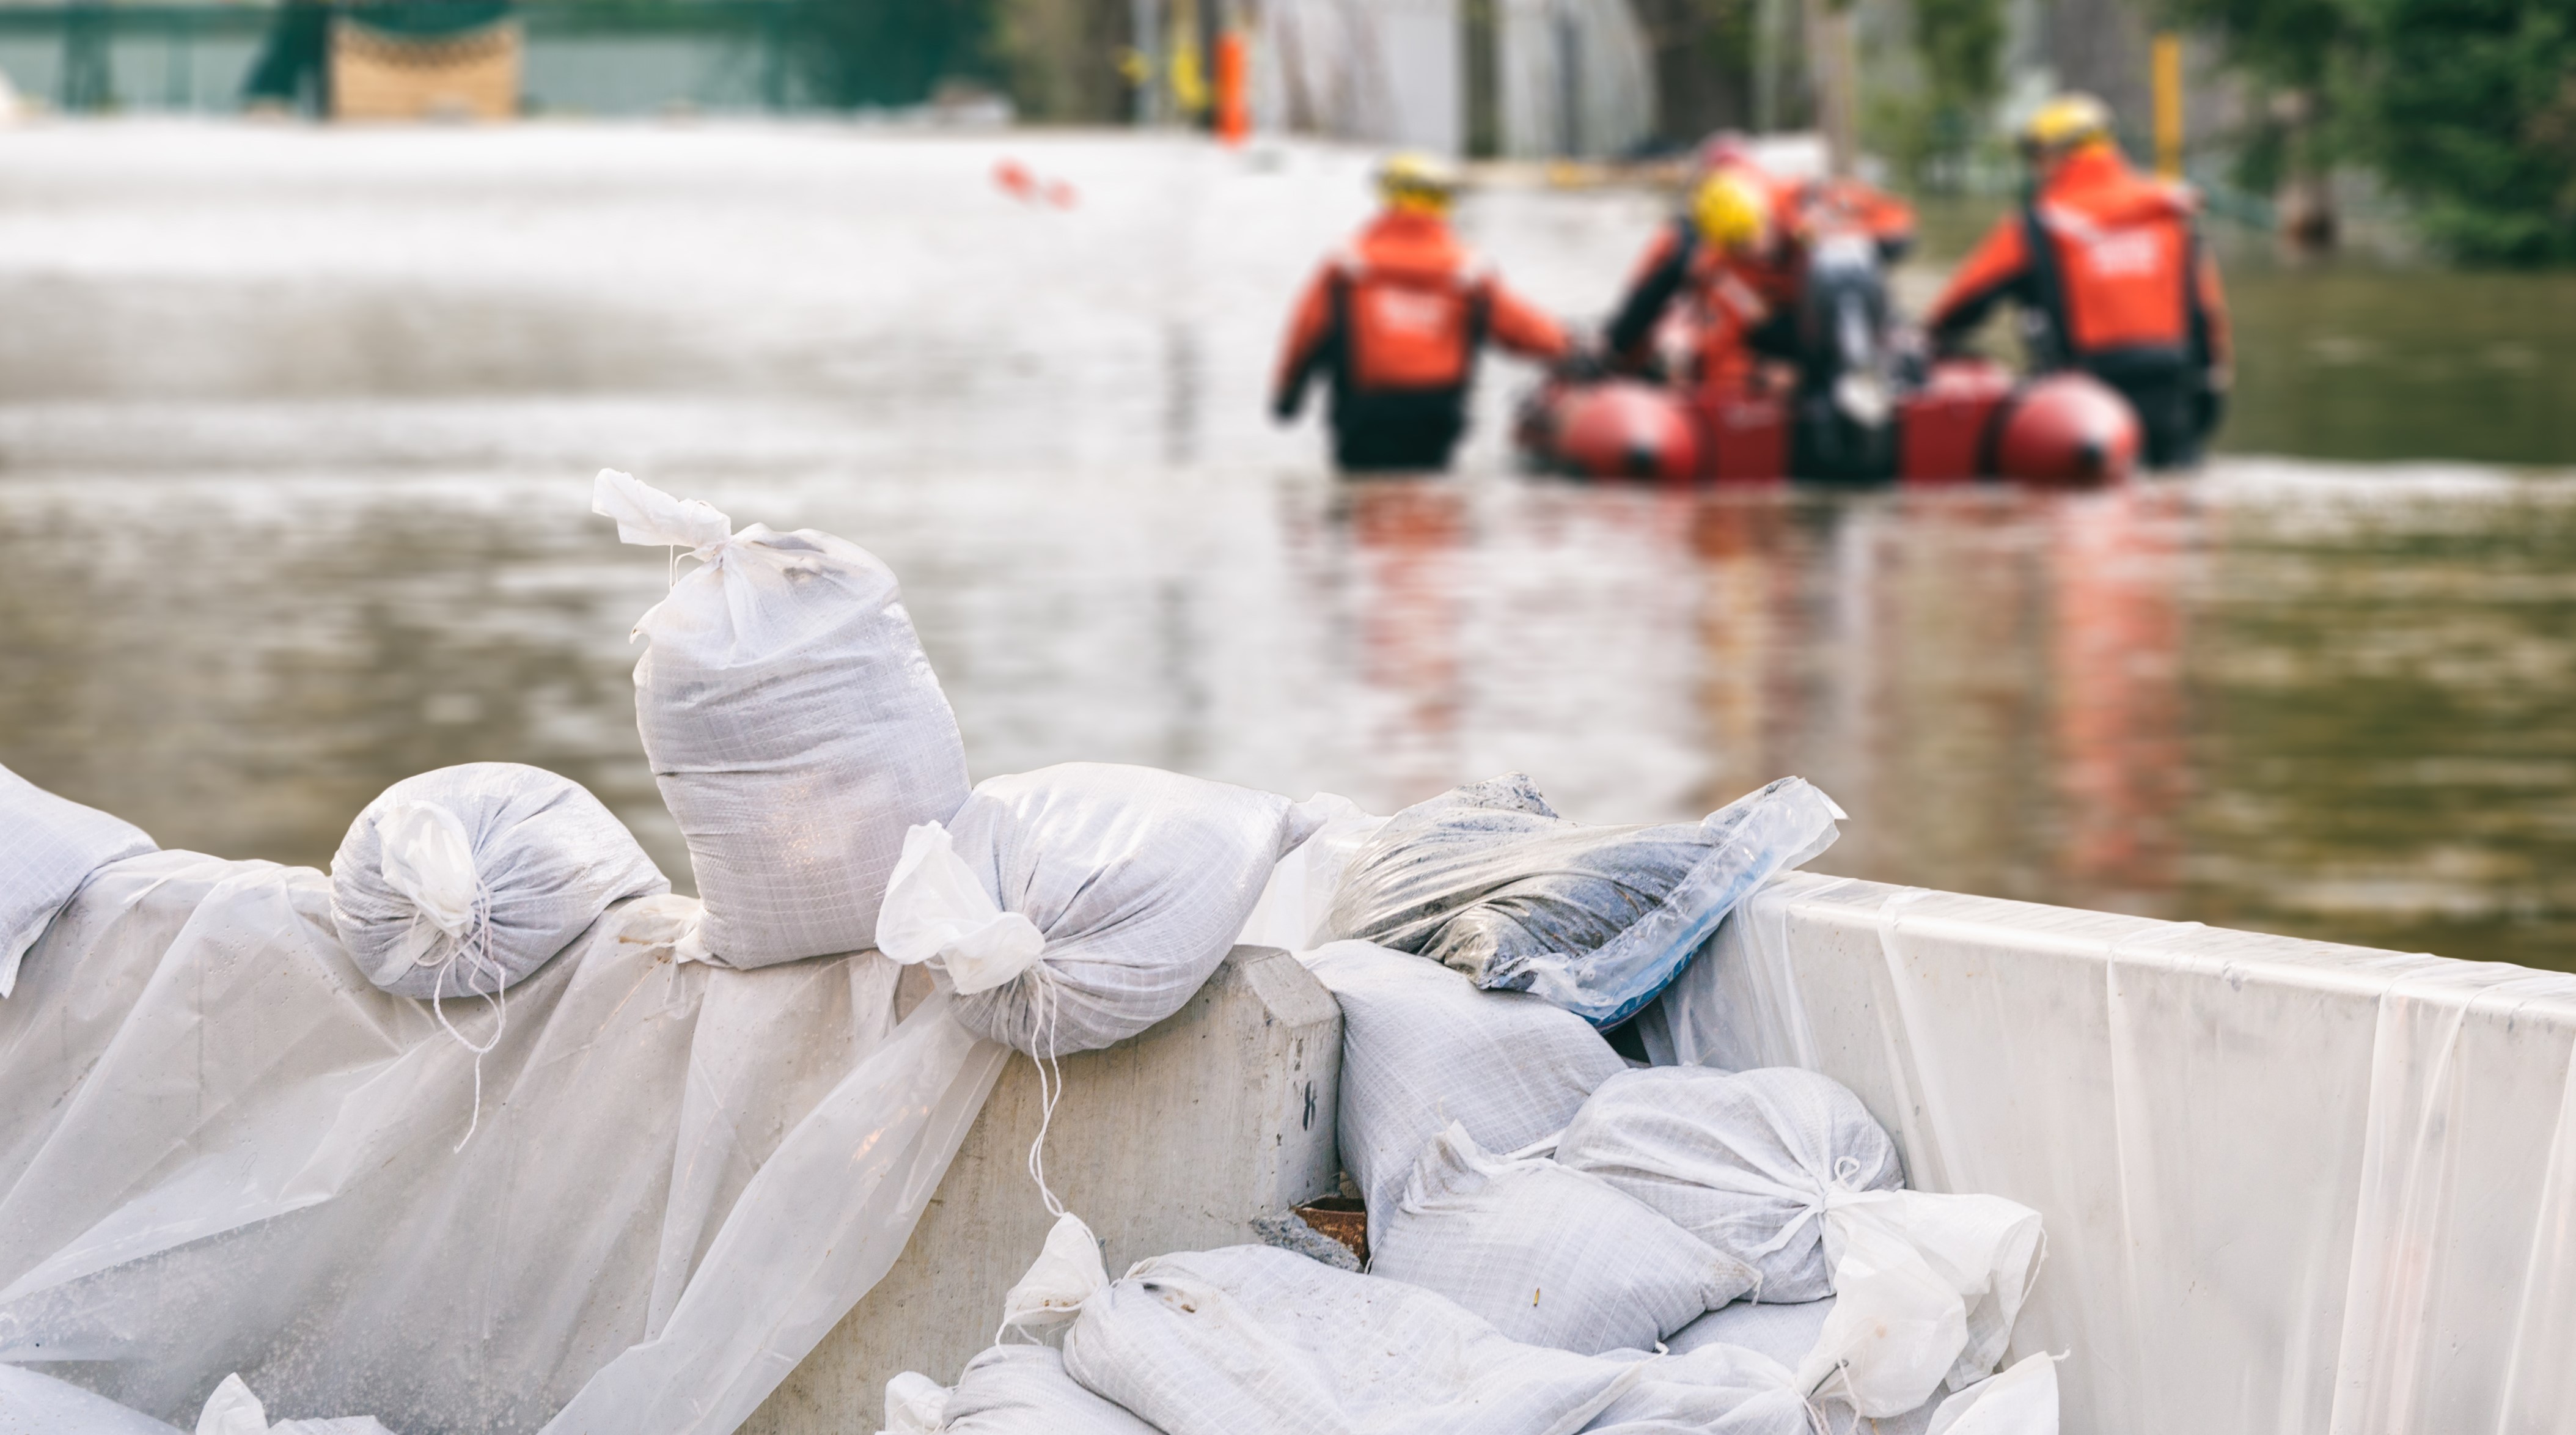
Flood risk and hazard mapping is important for efficient flood risk management. The flood maps are used to prevent flood damages, for land use planning and rescue operations.
How can it help?
With satellite imagery it is possible to map the extent of an area that has been subject to either a flood or hazard, and assess the damage, getting a full overview of where aid is needed the most.
What you get!
Assess the amount of flooding in near real time by triggering satellites to map flooded areas. The flood hazard map can be acquired a few hours after flooding has occurred and delivered in less than 24-48 hours globally (different solutions apply)
Prevent or limit floods from happening again by mapping historical flood hazards to understand the risks and take mitigating actions based on time series of satellite imagery
Using high-quality Digital Terrain Models suitable for assessing flood depth coupled with enhancement of Digital Elevation Models through advanced image analysis (feature extraction)
Typical customers?
Urban planners to manage and understand the flood risks in urban planning zones
Civil security agencies to asses the potential severity and frequency of flood losses in emergency situations
NGOs and governments to map, plan and analyse flood risk problems from local to national scales
Specifications
Satellites and our services are global
Get these type of maps daily depending on the overpass schedule of the different satellites
Get information about historical floodings depending on availability of archived imagery
The raw satellite image is typically available within hours after the image acquisition (time needed for analysis and production of maps can vary from a few hours to days depending on size of area)
Price list
Let us know in advance where and when you expect a flooding to occur and contact us for a quote!