
Wetland Monitoring with Earth Observation in Uganda

EOatDHI part of the DHI GROUP
gras@dhigroup.com
+45 4516 9100
Agern Alle 5,
2970 Hørsholm,
Denmark
CVR: 36466871

EOatDHI part of the DHI GROUP
gras@dhigroup.com
+45 4516 9100
Agern Alle 5,
2970 Hørsholm,
Denmark
CVR: 36466871


Tracking of national wetland inventory in Uganda. Wetland monitoring provides important insights for reporting on the Sustainable Development Goals.

The project has demonstrated how Earth Observation (EO) can support wetland monitoring in Uganda and with continued training sessions can become a valuable tool for wetland managers and practitioners, not only in Uganda, but potentially also paving the way for other East African countries to achieve a wetland inventory in the future.
Delivering a toolbox for wetland inventory mapping and demonstrating how Earth Observation can provide a full national wetland inventory in Uganda
Online portal for SDG reporting on SDG indicator 6.6.1 on wetland extent
Training national stakeholders in Uganda, and other RAMCEA countries, and providing a “lessons learned” and “roadmap” document for roll-out of the method, toolbox and online portal to other RAMCEA countries
The project was a unique demonstration of the full implementation of using Earth Observation to support the monitoring of wetland ecosystems on the national scale in Uganda.
Wetland monitoring is crucial for conservation and restoration of wetland ecosystems in Uganda which is explicitly mentioned in the national development plans. Hence, monitoring and reporting is not only important for reporting on the Sustainable Development Goal indicators, but should be anchored within and used by the national agencies to avoid further degradation of wetlands.
Within this project, a national baseline mapping of wetlands in Uganda was performed for 2016-2017 using all available Sentinel-1 and Sentinel-2 imagery to act as a baseline for SDG indicator reporting.
This also included a training component with three training courses, leveraging the GlobWetland Toolbox for doing national-scale wetland mapping and the inclusion of field data for classifier training and product validation, where the engagement of the local stakeholders and experts are key.
The open source toolbox provided to the local stakeholders consists of a specific component producing statistics and reports for SDG reporting which can be used by e.g. the Uganda Bureau of Statistics who are responsible for the SDG indicator reporting at the national level.
This is available from the online portal where the data, statistics and reports can be explored by users and agencies.
One of the other key aims of the project was to use the implementation in Uganda as demonstration case for uptake of the tools and methods by the other RAMCEA member countries. This was obtained through participation of key staff from the other RAMCEA countries in the training workshops, and by delivering guidance documents on “lessons learned” and “roadmap” for a roll-out.
The online portal for the project is now operated by the Ministry of Water and Environment in Uganda.
The project is funded by the Global Partnership on Sustainable Development Data (GPSDD) with support from the World Bank's Trust Fund for Statistical Capacity Building (TFSCB) with generous contribution by the Department for International Development (DFID), Irish Aid, and Korea.

EOatDHI part of the DHI GROUP
gras@dhigroup.com
+45 4516 9100
Agern Alle 5,
2970 Hørsholm,
Denmark
CVR: 36466871
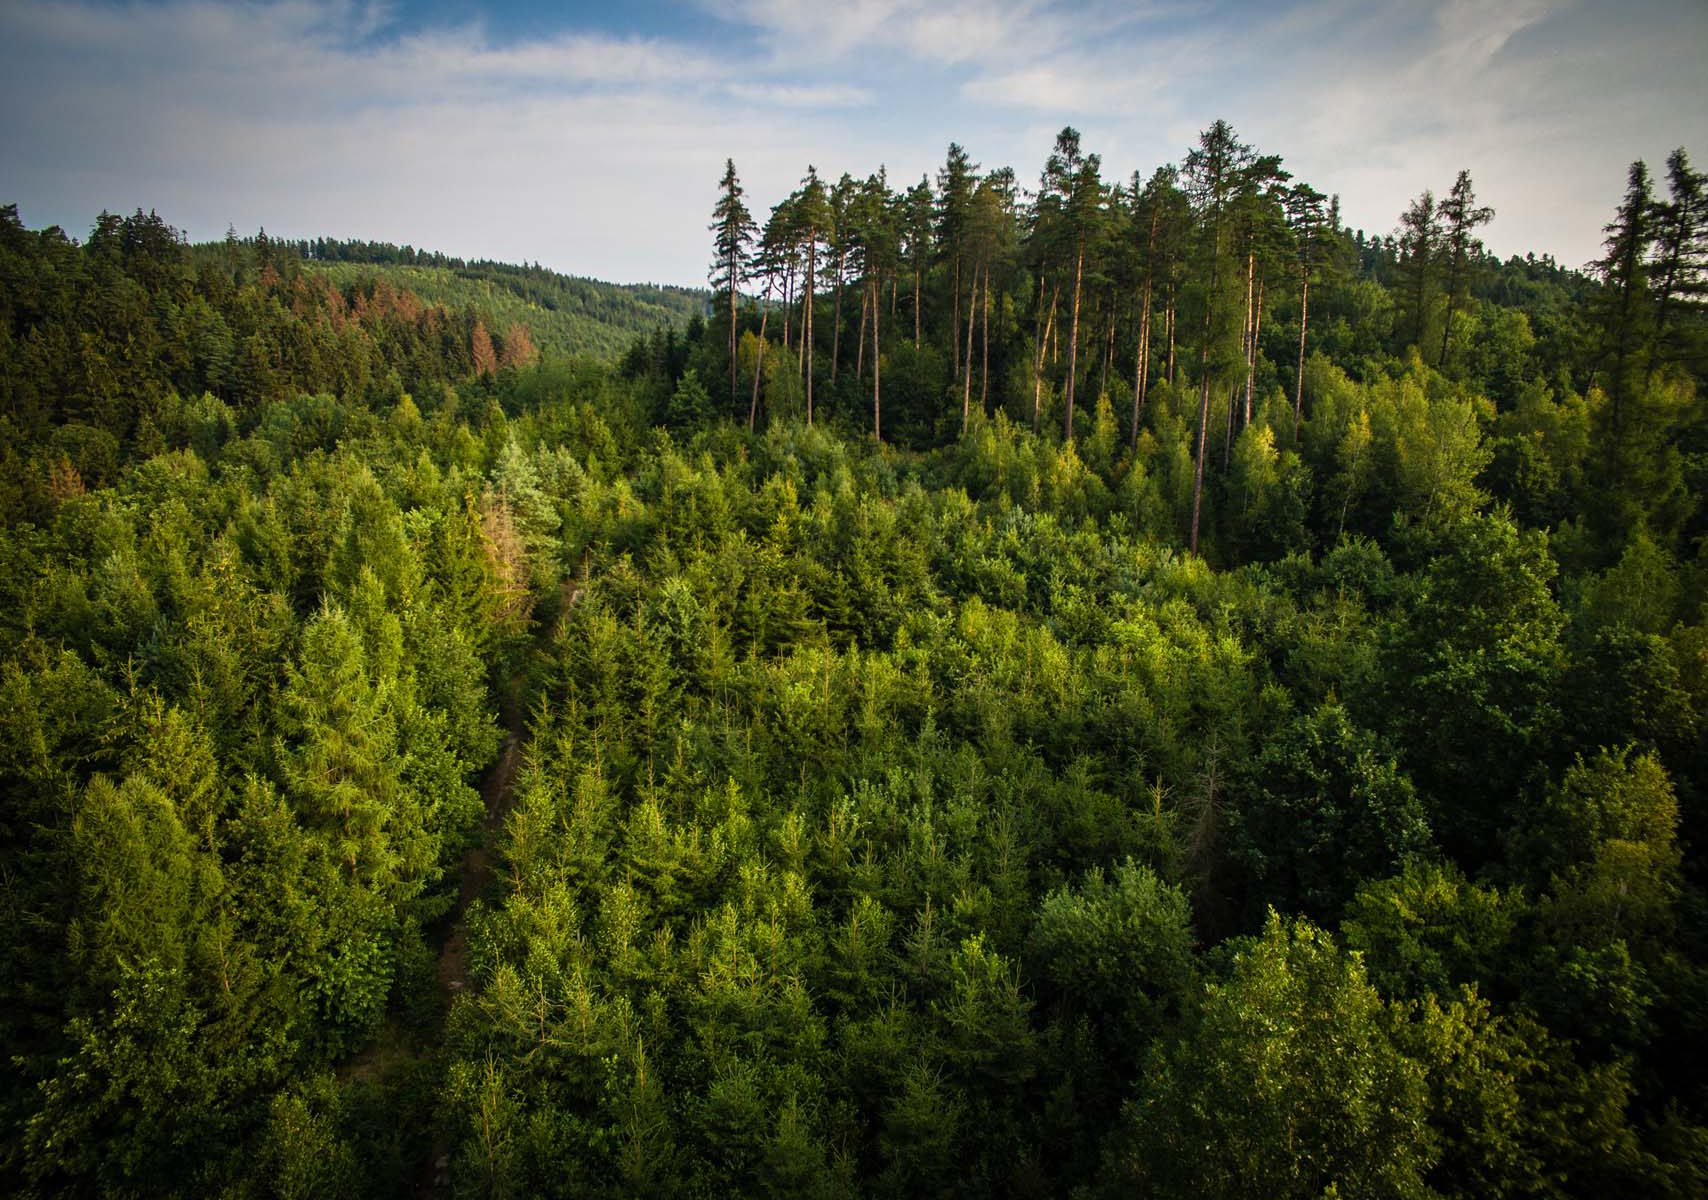
Each year millions of hectares of forests around the world are being degraded . . . . .
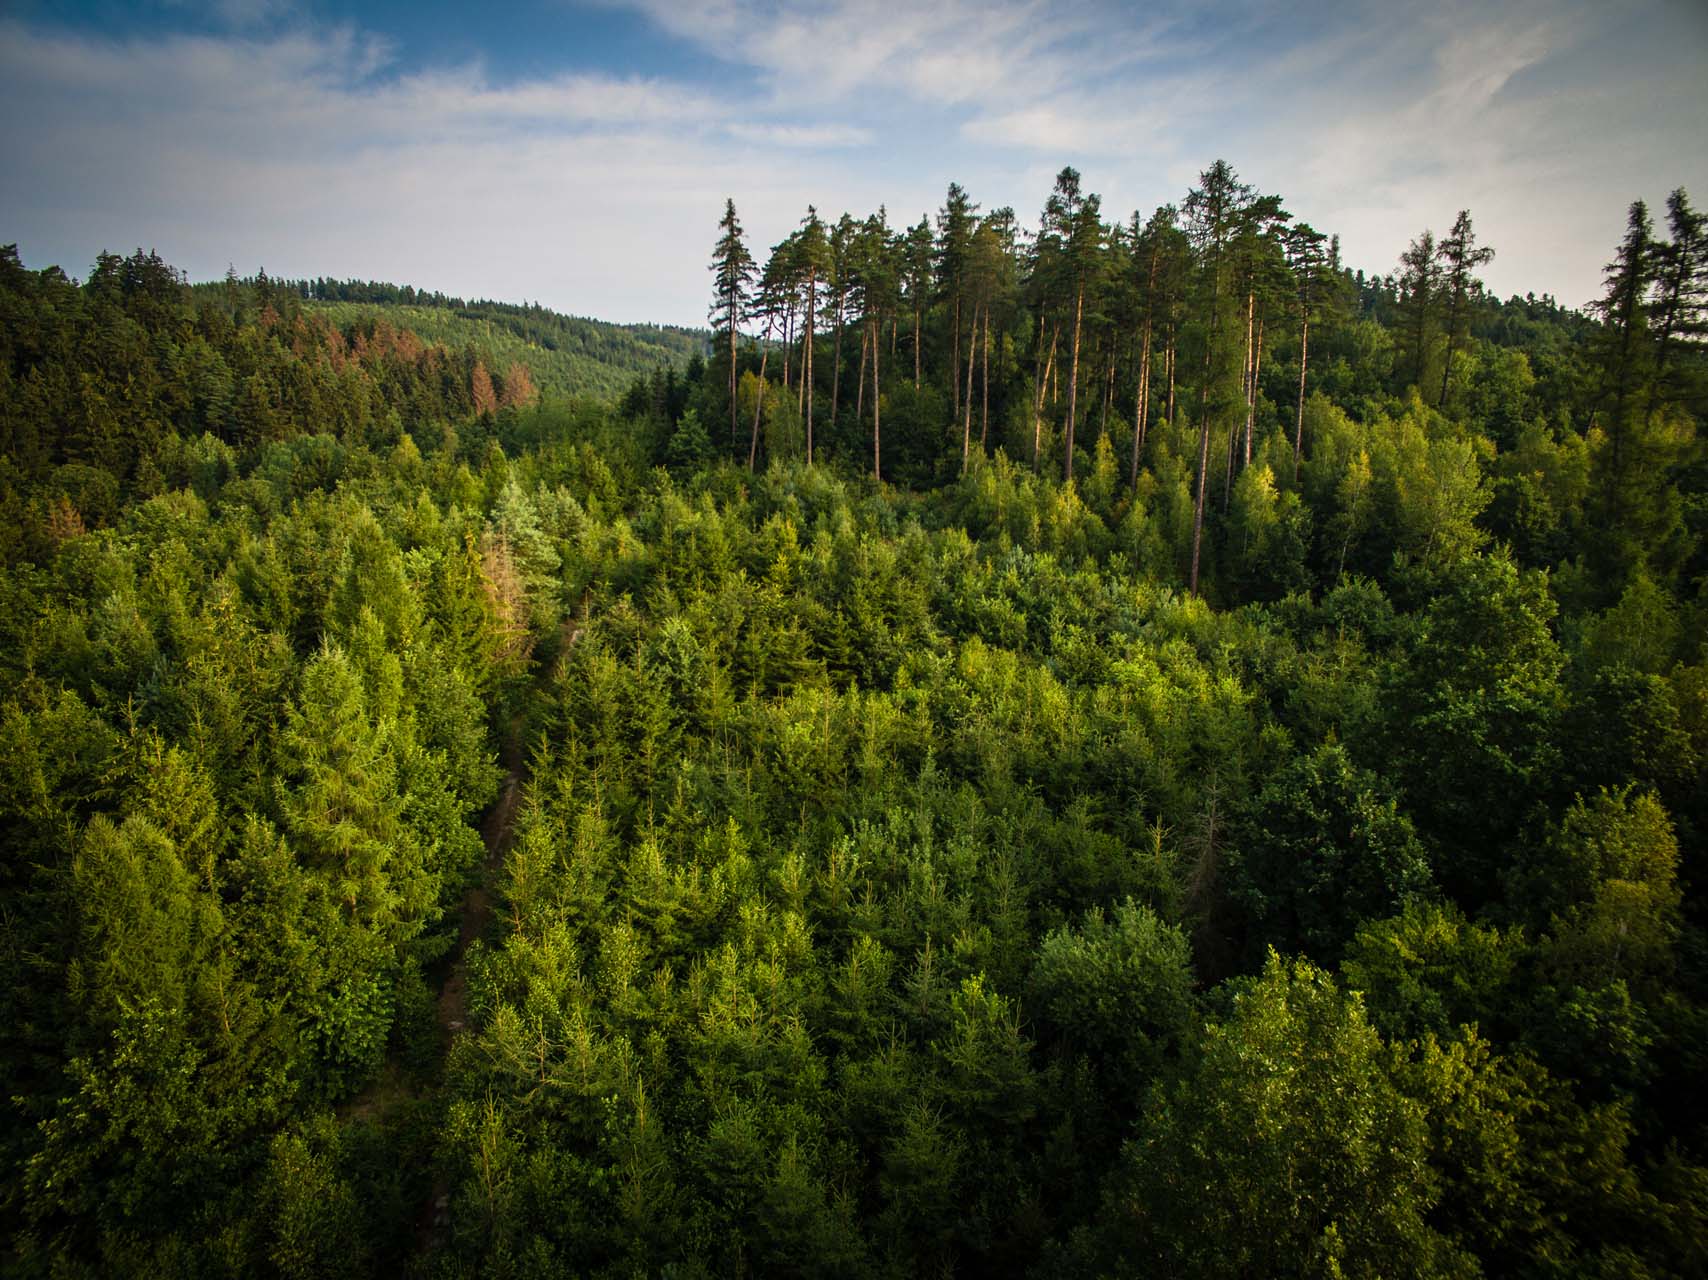
Forest monitoring with satellite data provide the consistent coverage needed to estimate forest cover area and forest cover changes over large areas.
This information is critical for decision makers and practitioners to take timely actions to protect forests and to promote sustainable forest monitoring and management as each year millions of hectares of forests around the world are being lost or degraded due to deforestation and wildfires.
GIS maps to effectively share information about forest cover and land use
Ability to visualize and analyze the location and pace of deforestation
Better understanding of linkages between deforestation and issues such as e.g. forest fires and watershed hydrology
Typically 10 meter resolution
Data can be obtained from anywhere on Earth
Cover large areas instantaneously to complement field data
Go 40 years back in time to estimate long-term forest changes
Monitoring information can be provided on a weekly basis
All weather capacity mapping through clouds and at night with Synthetic Aperture Radar (SAR) data
Data available in a ready to use format for easy incorporation into existing GIS systems and databases
Contact us for a quote
EOatDHI part of the DHI GROUP
gras@dhigroup.com
+45 4516 9100
Agern Alle 5,
2970 Hørsholm,
Denmark
CVR: 36466871
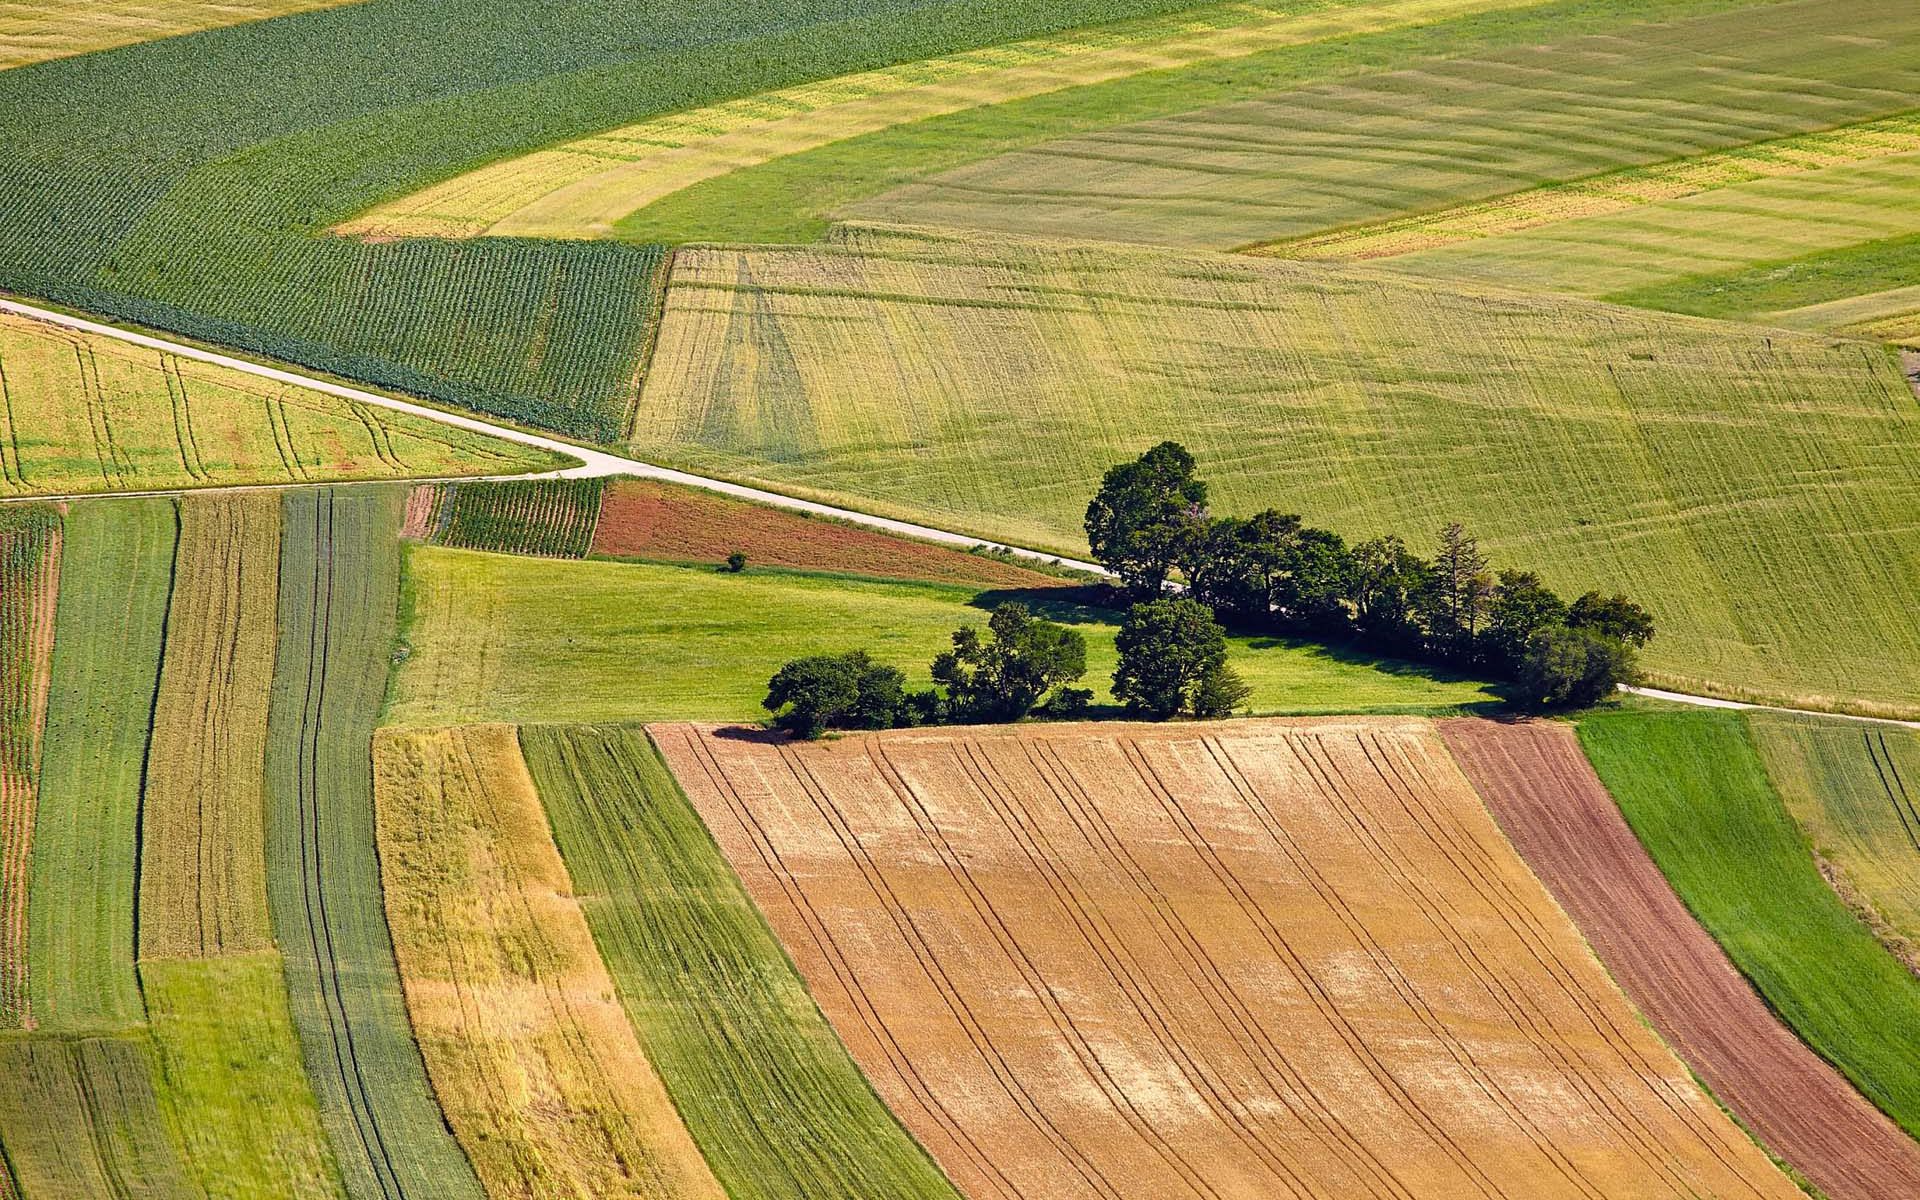
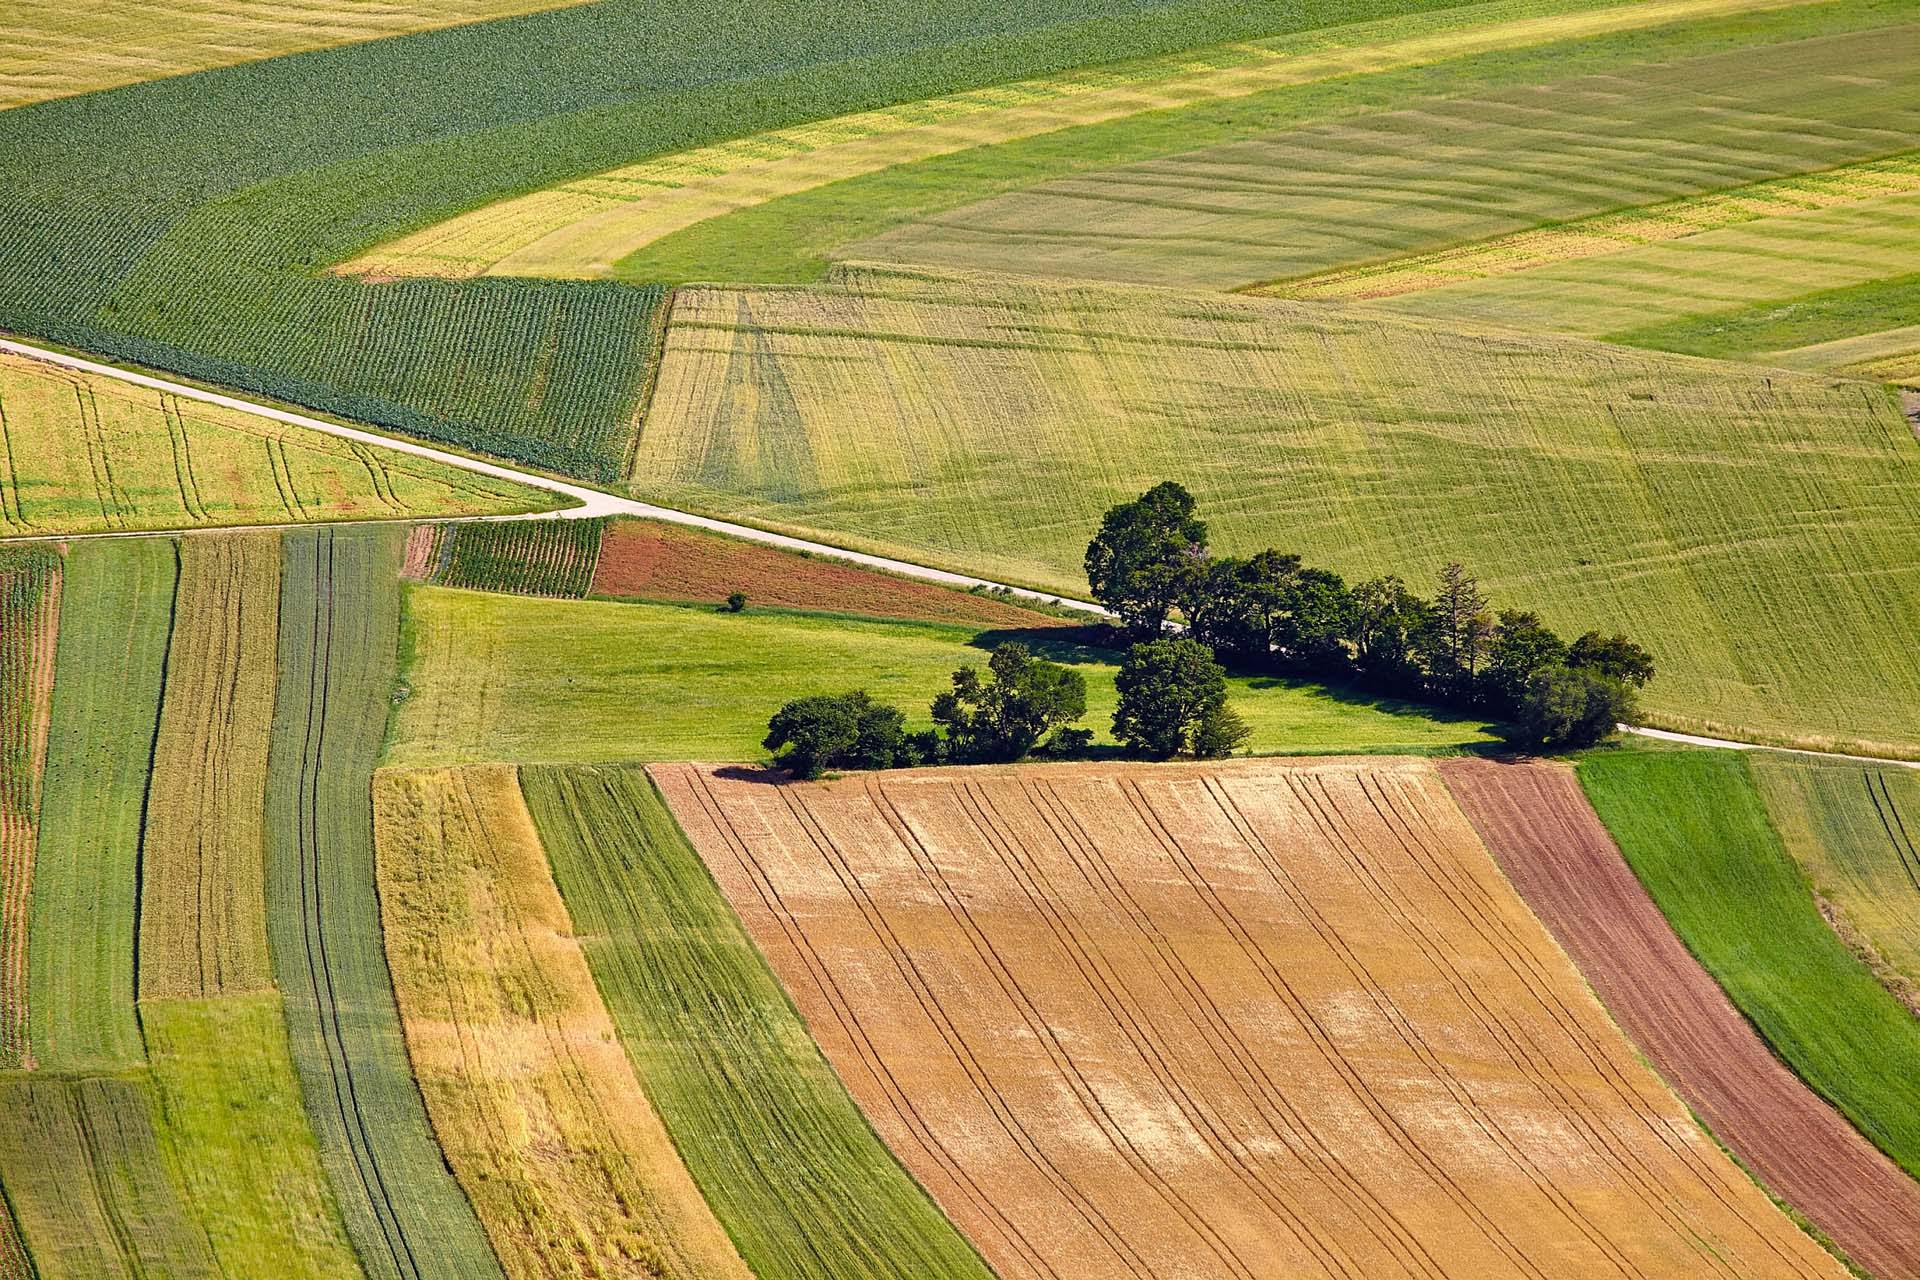
Crop mapping inventory, acreage and growth monitoring is needed for government and national purposes . . .
Up to date crop area and statistics of the major crop types
In-season operational assessment of crop health and status
Valuable information on crop type and acreage statistics can be provided on annual and semi-annual basis
Agronomist can use crop inventory as input to models for the further assessment of harvest and yield prediction, soil productivity, or land use intensity
Agencies use crop inventories to monitor and plan growing seasons and for EU regulations on subsidies for crops
Agricultural companies such as fertilizer companies and seed producers can use crop information to better manage supply chains and improve sales
Crop classification is benefitting from the recent surge in SAR and optical data availability, coupled with the development of advanced machine-learning classification algorithms.
SAR data provides information relating to structural characteristics of crops, including size, density, orientation and surface roughness, while optical imagery provides data related to leaf pigmentation, cell structure and moisture content.
We use a data fusion approach to crop classification as it offers the highest potential for accurate mapping. We have provided crop type mapping with average accuracies up to 95%.
The main output attribute of the classification will be the predicted crop class for each field parcel in the control zone. As an additional source of information that can help to evaluate class confidence, we will include crop class probability values.
The production of custom tailored crop inventory is between 1.5 and 2.5 Euro/km2.
For operational crop monitoring please contact us.
EOatDHI part of the DHI GROUP
gras@dhigroup.com
+45 4516 9100
Agern Alle 5,
2970 Hørsholm,
Denmark
CVR: 36466871
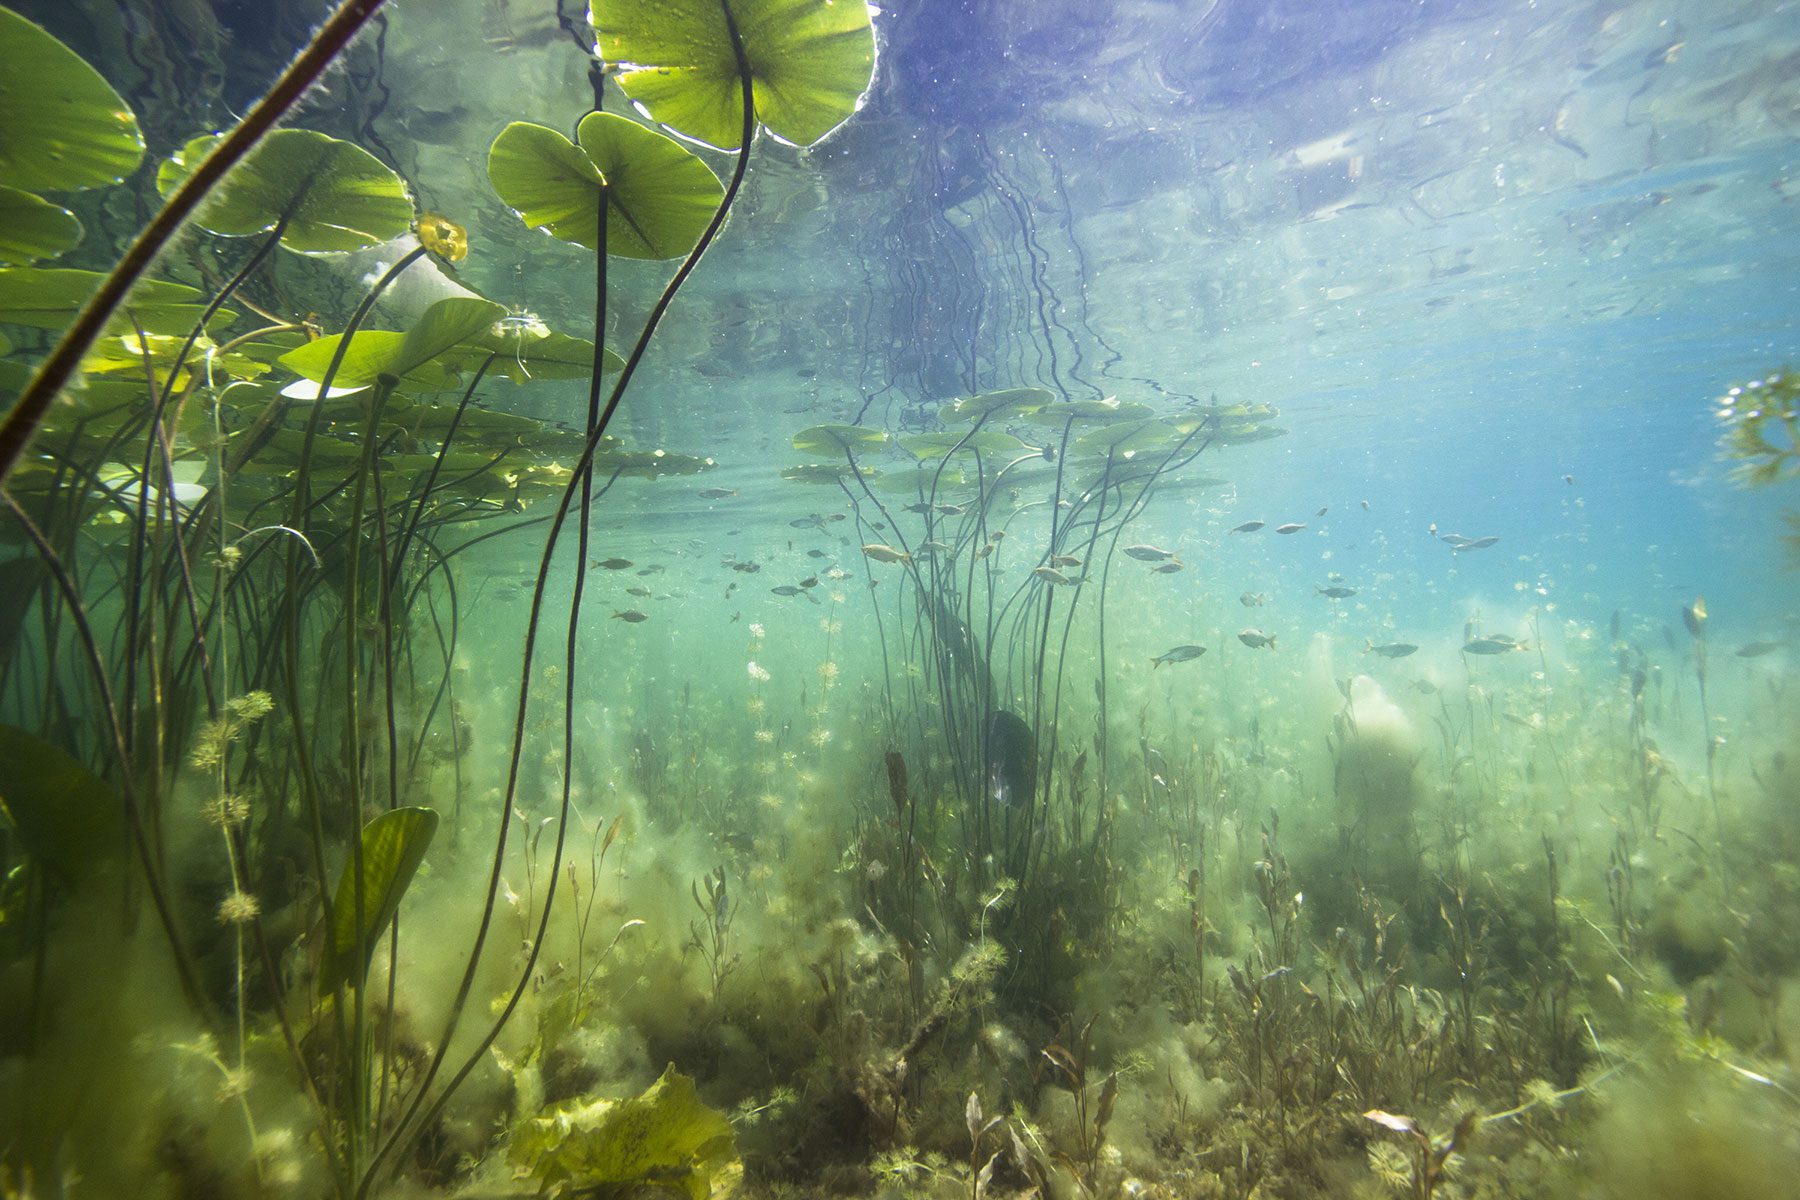
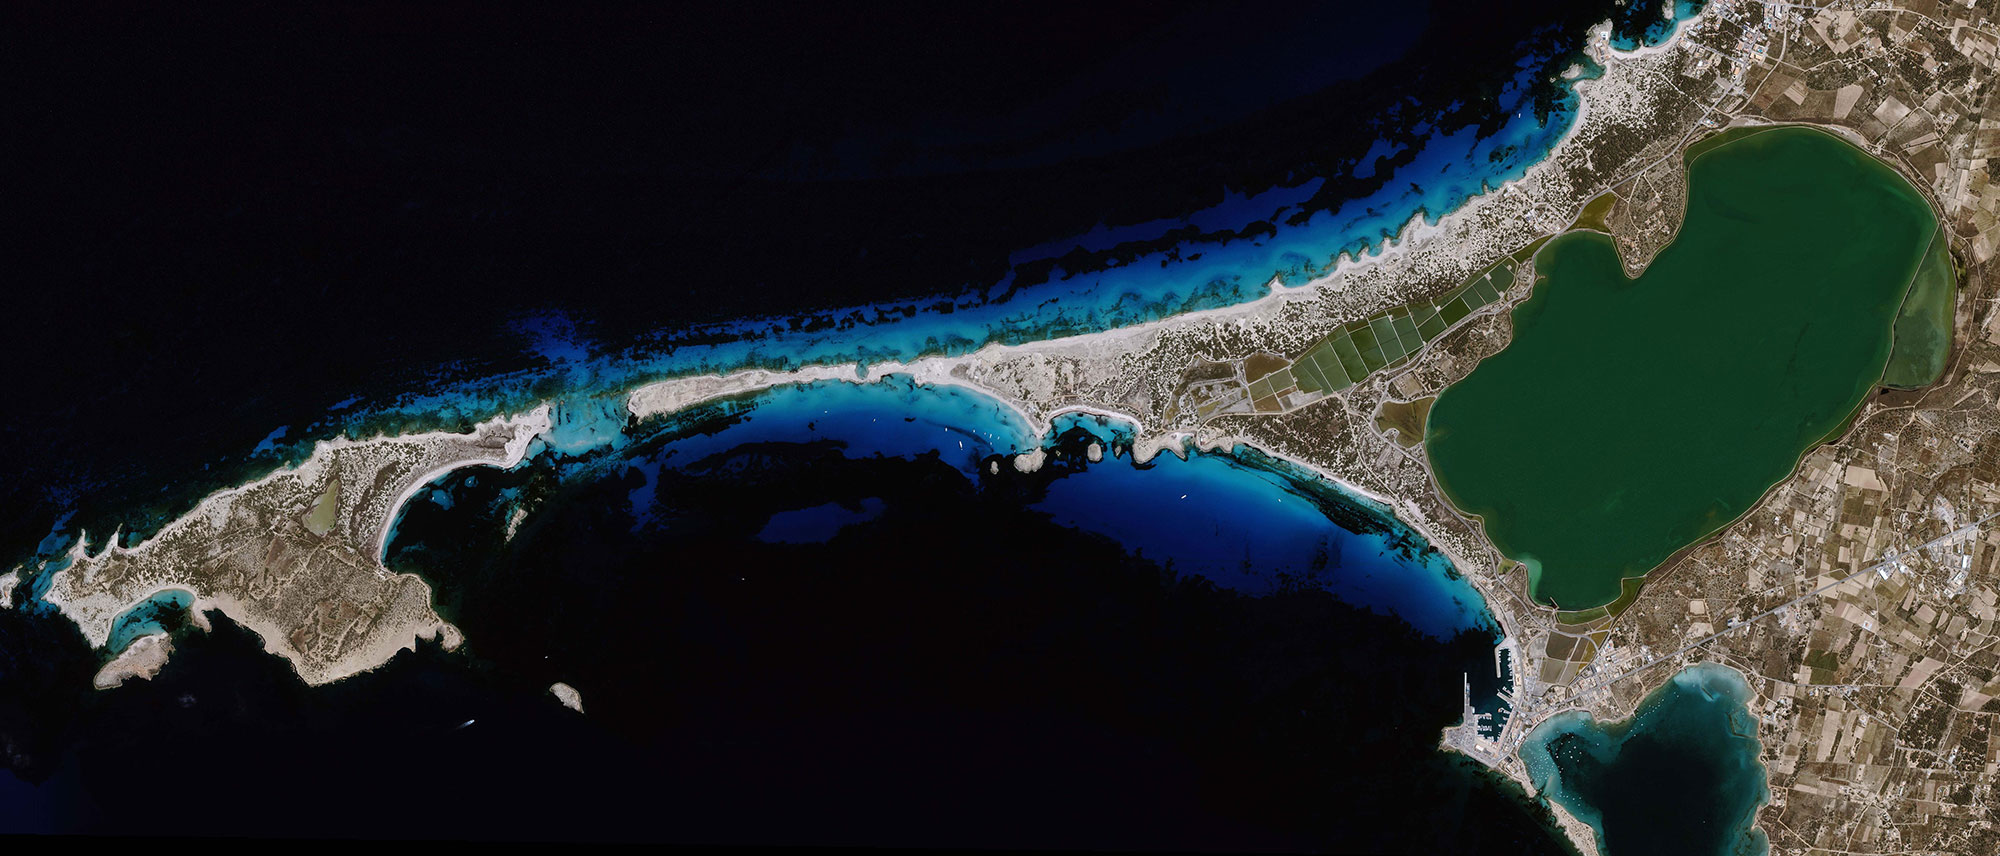
Assessing water quality and its variability in space and time to be able . . .

Detailed and customised mapping of the water quality in your water environment with very fast turn-around time
Insights into historical water quality conditions and comparison with present information
Seamless integration of information from Earth Observation and in situ monitoring into your decision support system
Contractors to survey the impact of construction work in marine environments
Authorities to complement or redesign traditional water quality monitoring for their monitoring obligations, e.g. for the Water Framework Directive or support early warnings of occurrences of algae blooms, red tides and sediment plumes
Aquaculture farmers to monitor water condition and its variability in space and time or support site selection decisions
Contact us for a quote
EOatDHI part of the DHI GROUP
gras@dhigroup.com
+45 4516 9100
Agern Alle 5,
2970 Hørsholm,
Denmark
CVR: 36466871
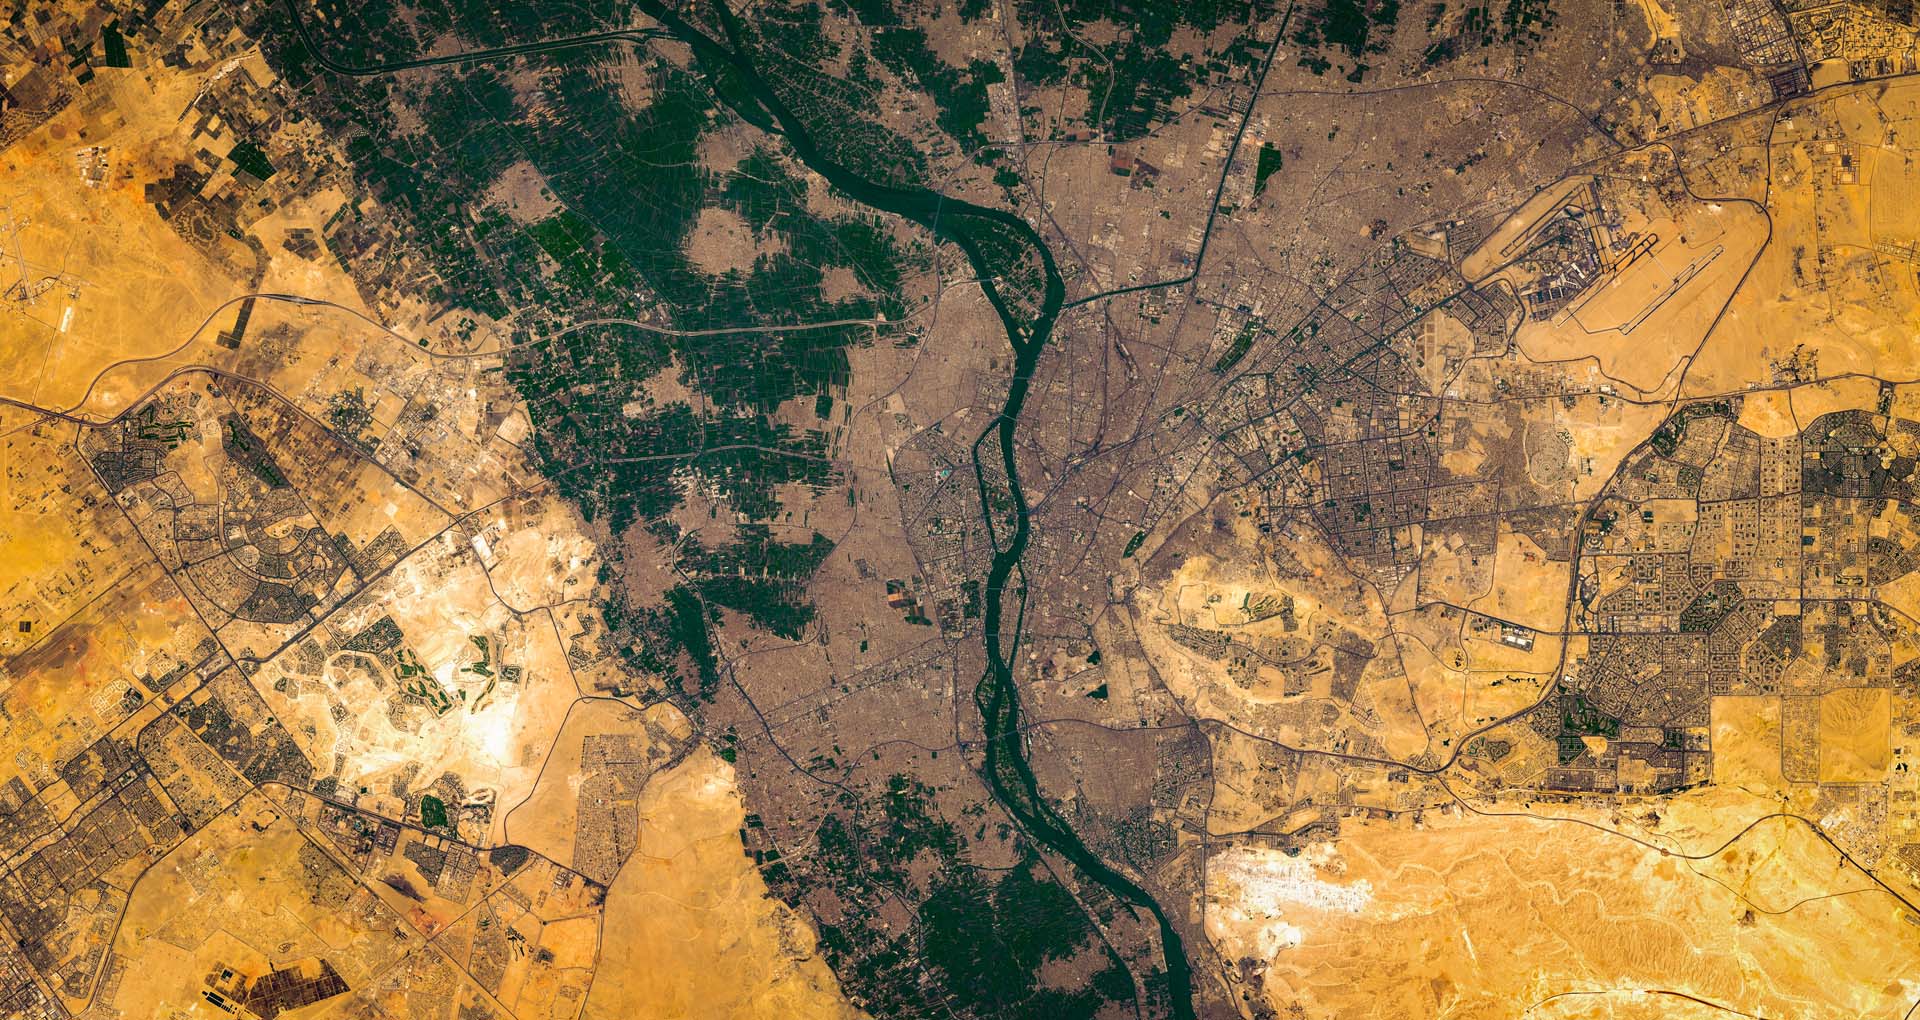
Satellite-based map layers to document resource assessment is highly valuable source of information
A product that fits into all types of GIS applications and other software packages
Access to independent and experienced advice on which satellite imagery fits your project the best
Access to a large portfolio (+50) of radar imagery with all-weather image capabilities
Municipalities looking for a cost-efficient overview of their area
Researchers looking for detailed imagery for research purposes
Planners looking for detailed insights for remote sites before field surveying and construction activities
WorldView-2: multispectral imagery at 1.8 meter resolution and panchromatic imagery at 0.46 meters
QuickBird: 60 cm resolution (panchromatic and pansharpened) and 2.4 m multispectral
GeoEye-1: 0.4 m resolution (panchromatic and pansharpened)
Ikonos: 4 m multispectral
RapidEye: 5 m
Pleiades: 4 band data at 2 m resolution and panchromatic data at 0.7 m
Get archived optical data products from €10/km² with a spatial resolution from 0.5 m
Get new optical data acquisition from €17/km² with a spatial resolution from 0.5 m
EOatDHI part of the DHI GROUP
gras@dhigroup.com
+45 4516 9100
Agern Alle 5,
2970 Hørsholm,
Denmark
CVR: 36466871
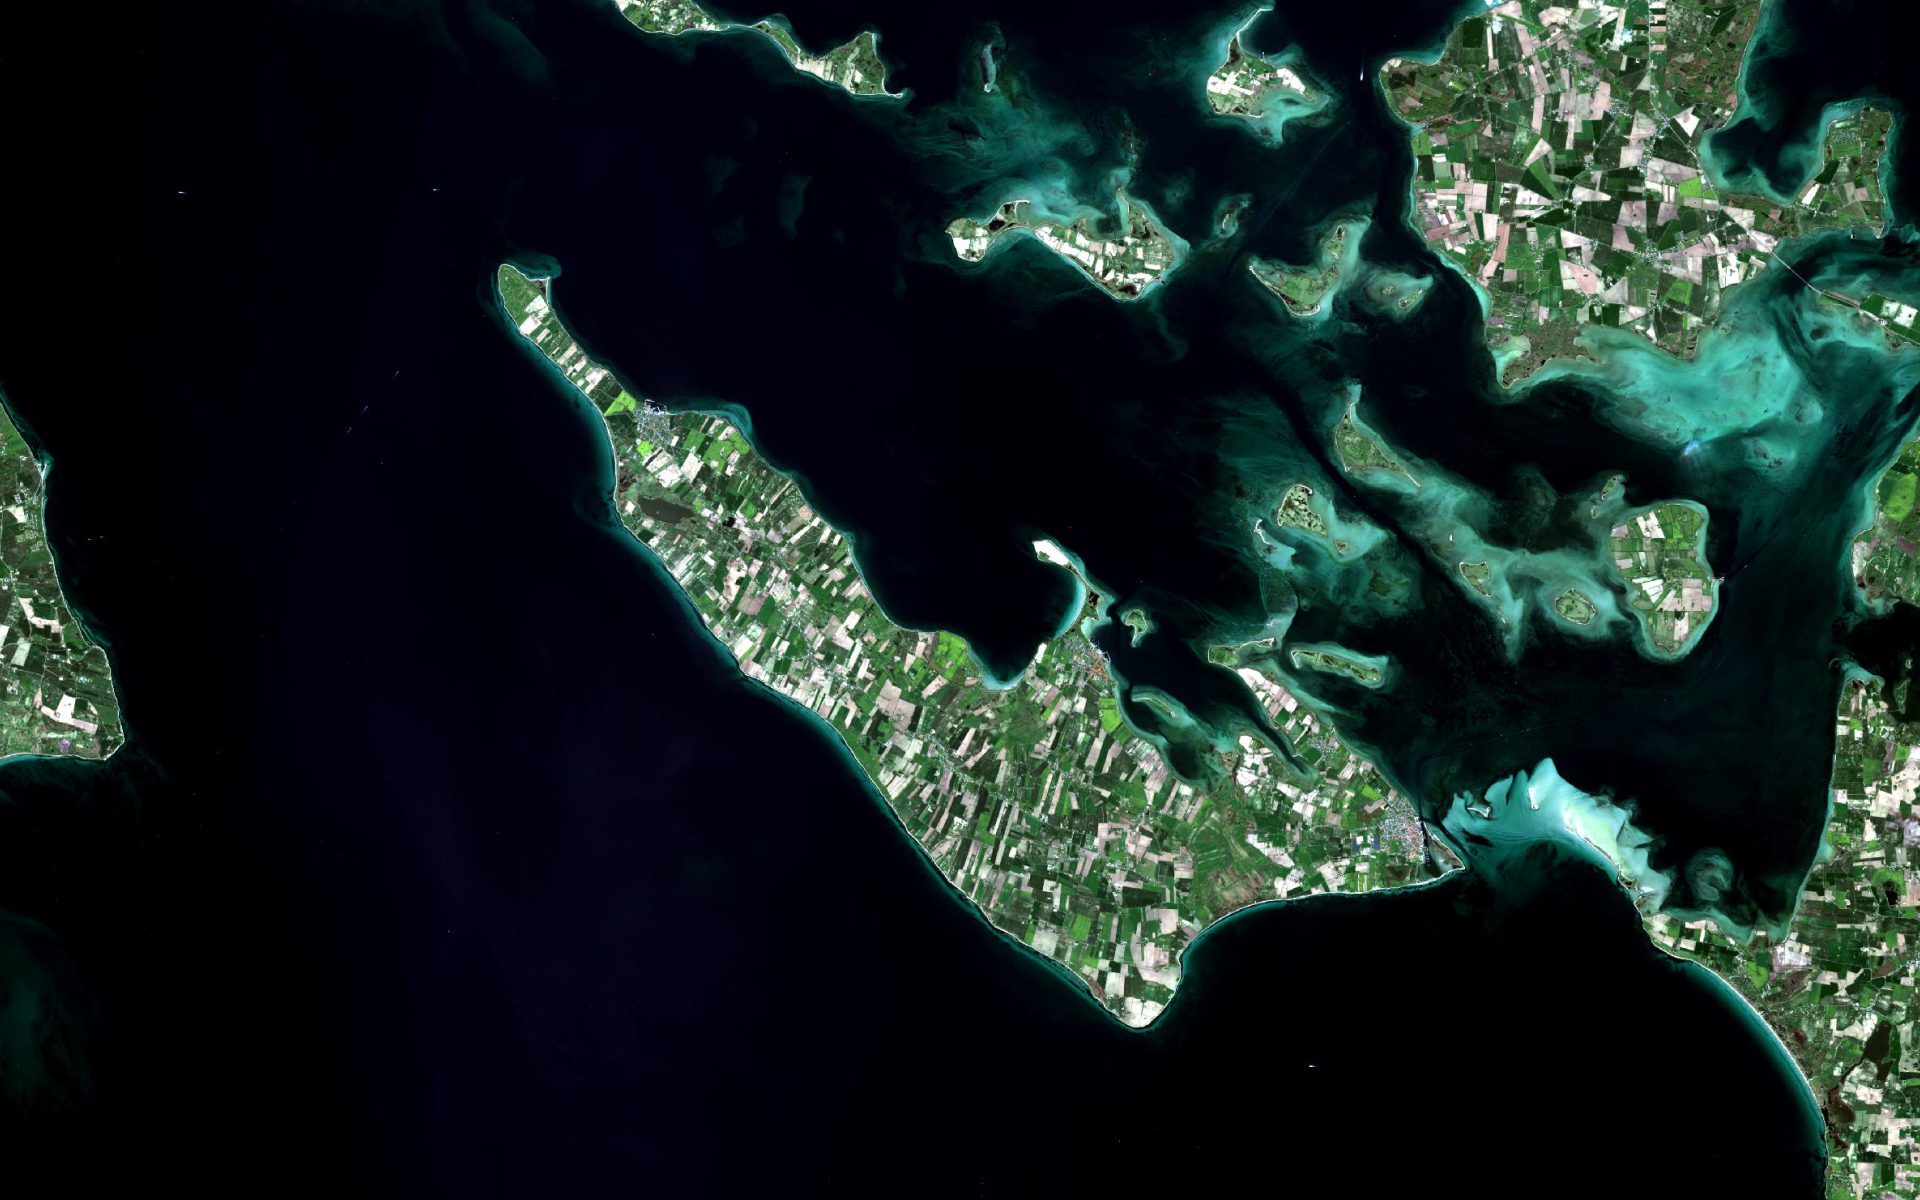
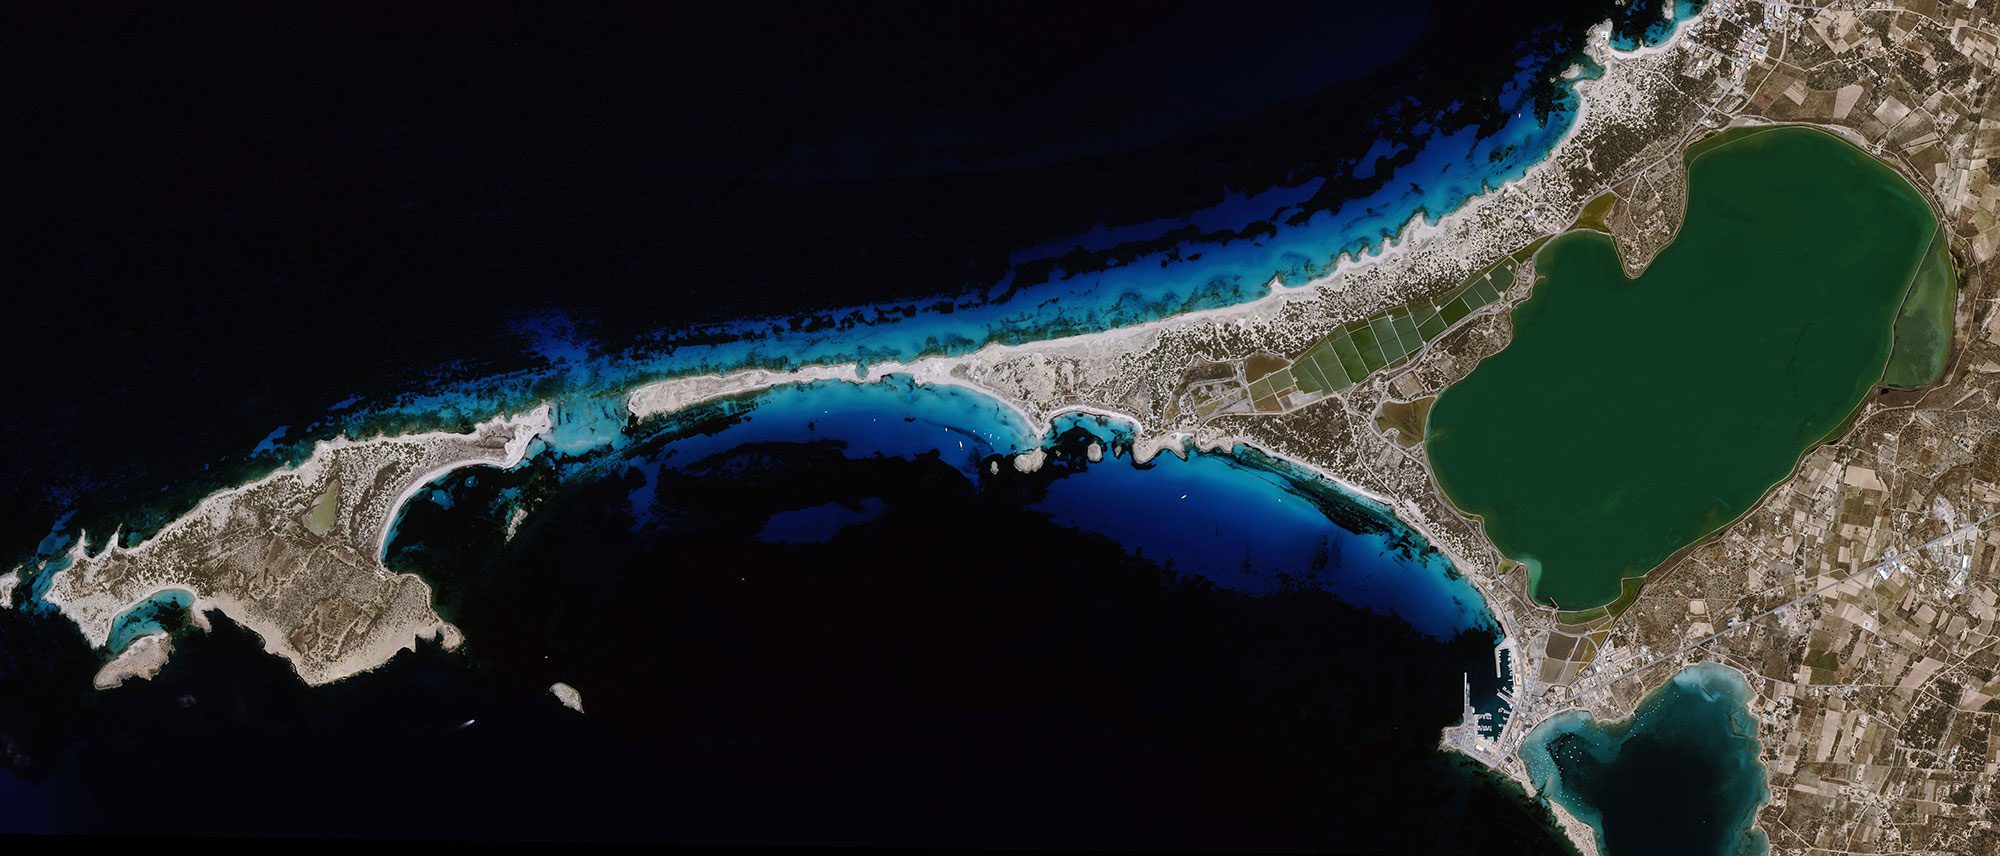
Mapping and measuring water depths from space to monitor constantly changing coastal environments . . .
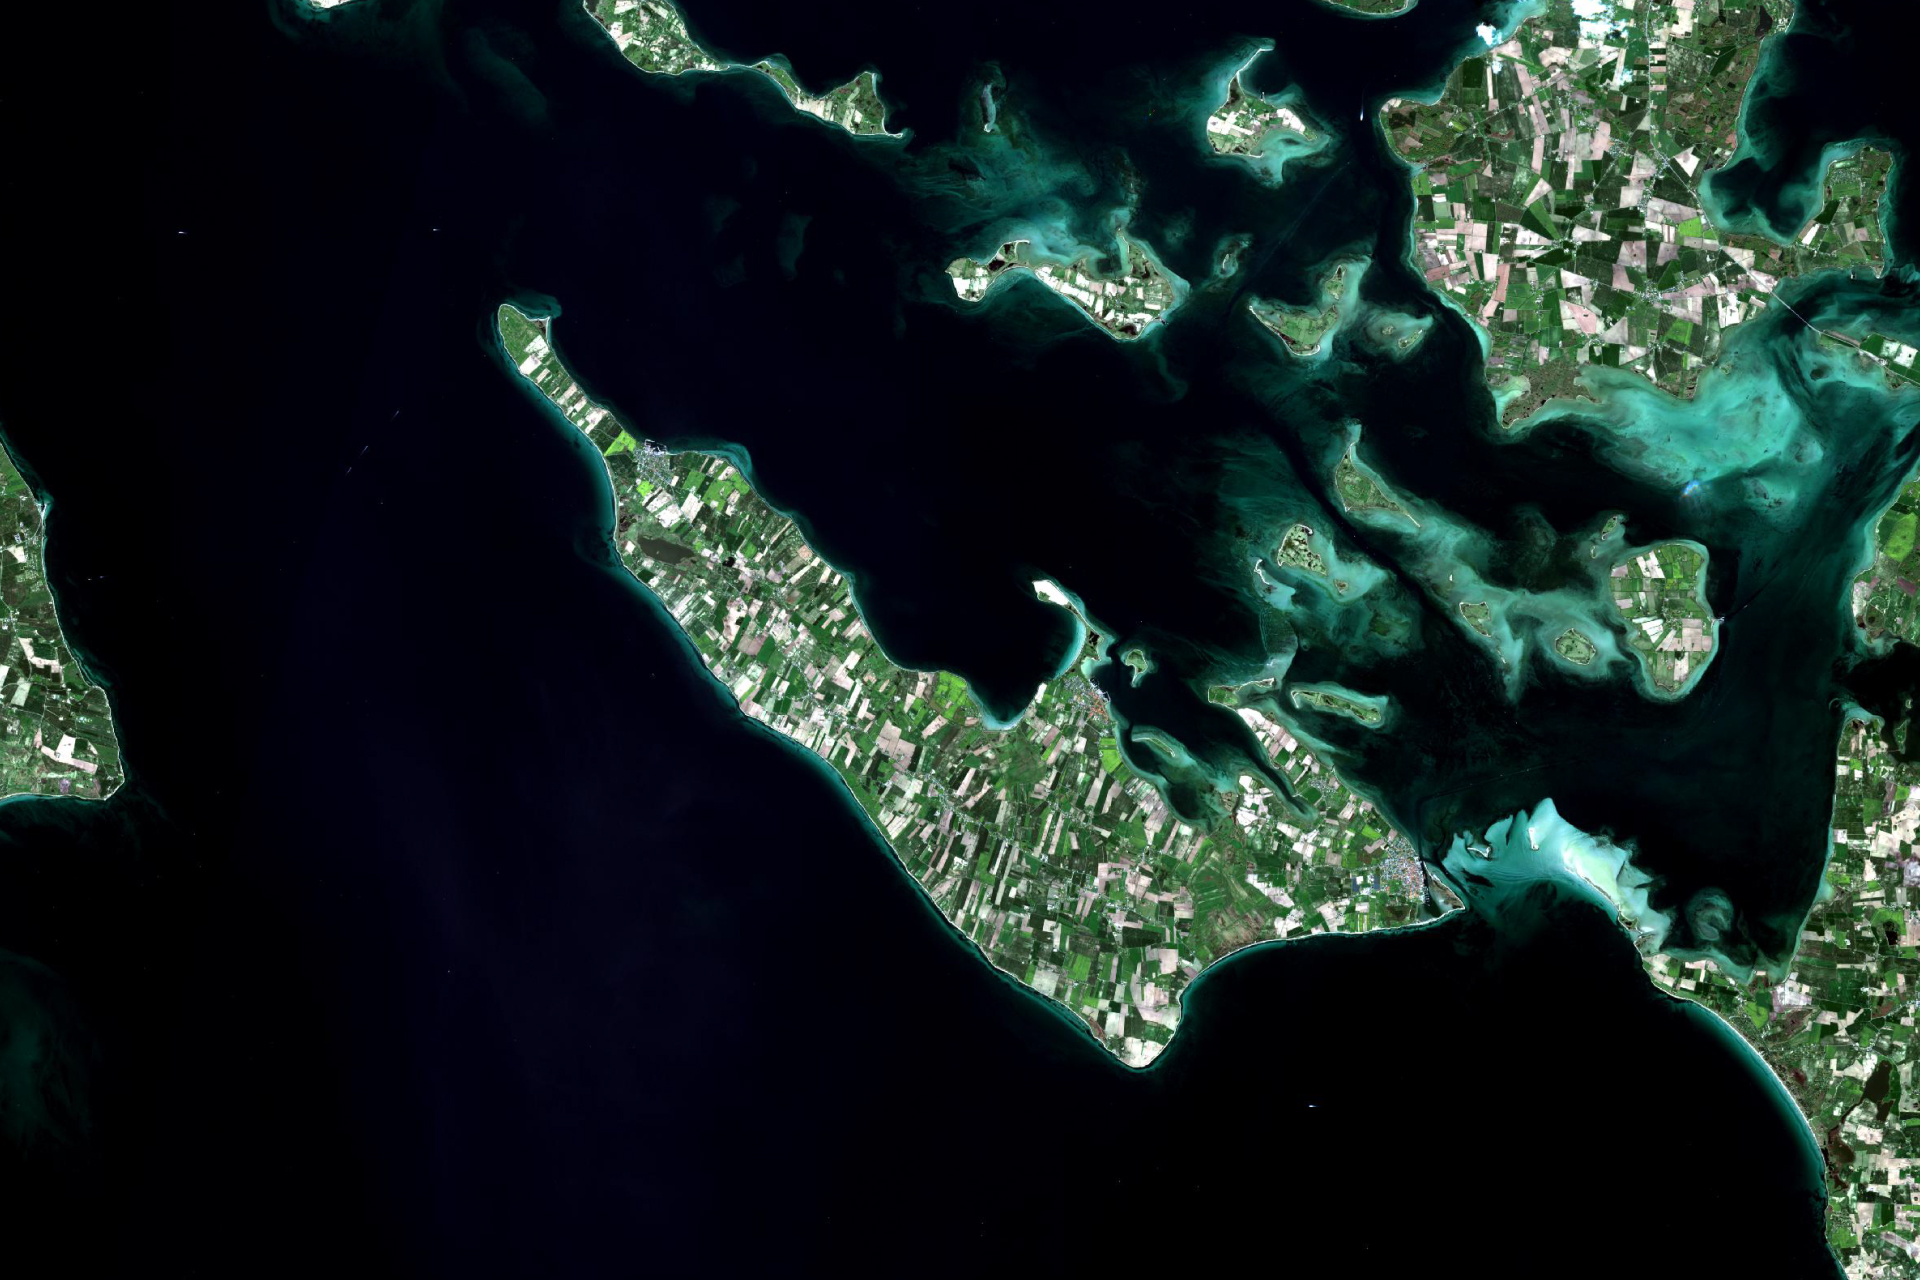
Very detailed mapping of the coastal and nearshore area in 2 to 10 meter spatial resolution
Very fast turn-around time no matter the location
Our proprietary methods and rigorous quality assessment ensures high quality data deliveries
Widely used by the modelling community where accurate bathymetry is required for any high quality hydrodynamic modeling of the coastal zone
Engineering companies working in the coastal zone use our data in the initial planning phase and as a first screening before conducting costly field campaigns
National authorities and hydrographic offices get up-to-date information about territorial waters and minimize navigational hazards within their area of responsibility
We are industry leading providers of satellite-derived bathymetry
Our solution is based on more than 10 years of research and development funded by European Commission, European Space Agency, national authorities and internal funds
We have a proven track record with satisfied clients all over the world
We have a fast turn-around on all deliveries
We offer a cost efficient and industry leading high-quality product
Globally applicable where conditions allow it
All data undergo a very thorough quality
Every data point comes with an associated derived uncertainty measure
Available resolutions:
2-m resolution
10-m resolution
Price range depends on size of Area of Interest
Contact us for details and custom quotes
EOatDHI part of the DHI GROUP
gras@dhigroup.com
+45 4516 9100
Agern Alle 5,
2970 Hørsholm,
Denmark
CVR: 36466871

Crop water use derived from Earth Observation data to facilitate increase in water-use . . . . .
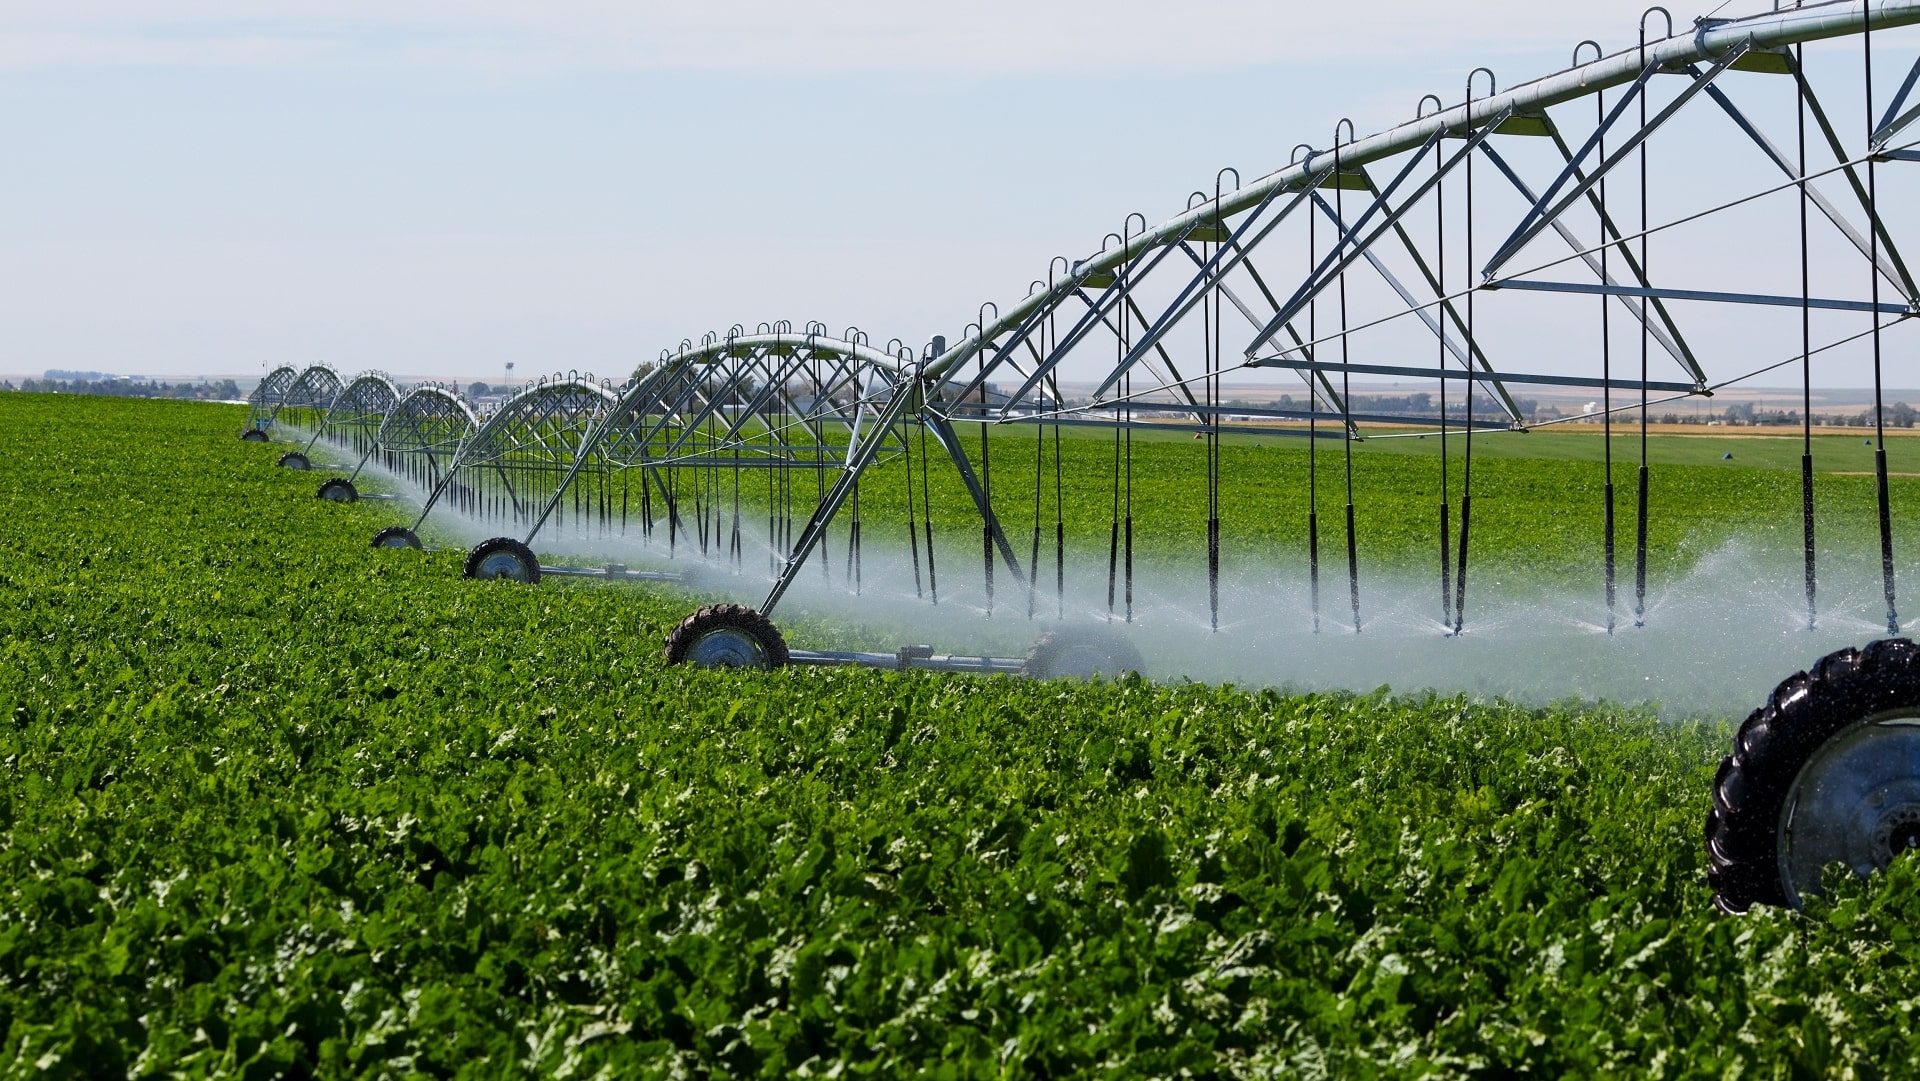
Advice on crop water stress, water withdrawal or irrigation efficiency based on the actual crop evapotranspiration
Soil moisture and vegetation water content maps
Information can be provided at regional or field scale at up to daily timescale (depending on the cloud cover)
Irrigation district managers can use this information to improve water allocation and short-to-medium term planning
Farmers can benefit from timely water-stress data to prevent wasteful over-irrigation and to improve crop quality through deficit irrigation at critical times of the growing cycle
Regional authorities can ensure that water users are abiding by the relevant legislation, e.g. related to amount of fresh water withdrawals or water use restrictions
Actual soil evaporation and crop transpiration derived with combined thermal and optical data
Soil moisture and vegetation water content derived using radar, thermal and optical data
Higher level products such as crop water stress, water withdrawals, irrigation efficiency, and water productivity
Maps can be produced at regional and field scales, with up to daily time step
Contact us for a quote
EOatDHI part of the DHI GROUP
gras@dhigroup.com
+45 4516 9100
Agern Alle 5,
2970 Hørsholm,
Denmark
CVR: 36466871
EOatDHI part of the DHI GROUP
gras@dhigroup.com
+45 4516 9100
Agern Alle 5,
2970 Hørsholm,
Denmark
CVR: 36466871