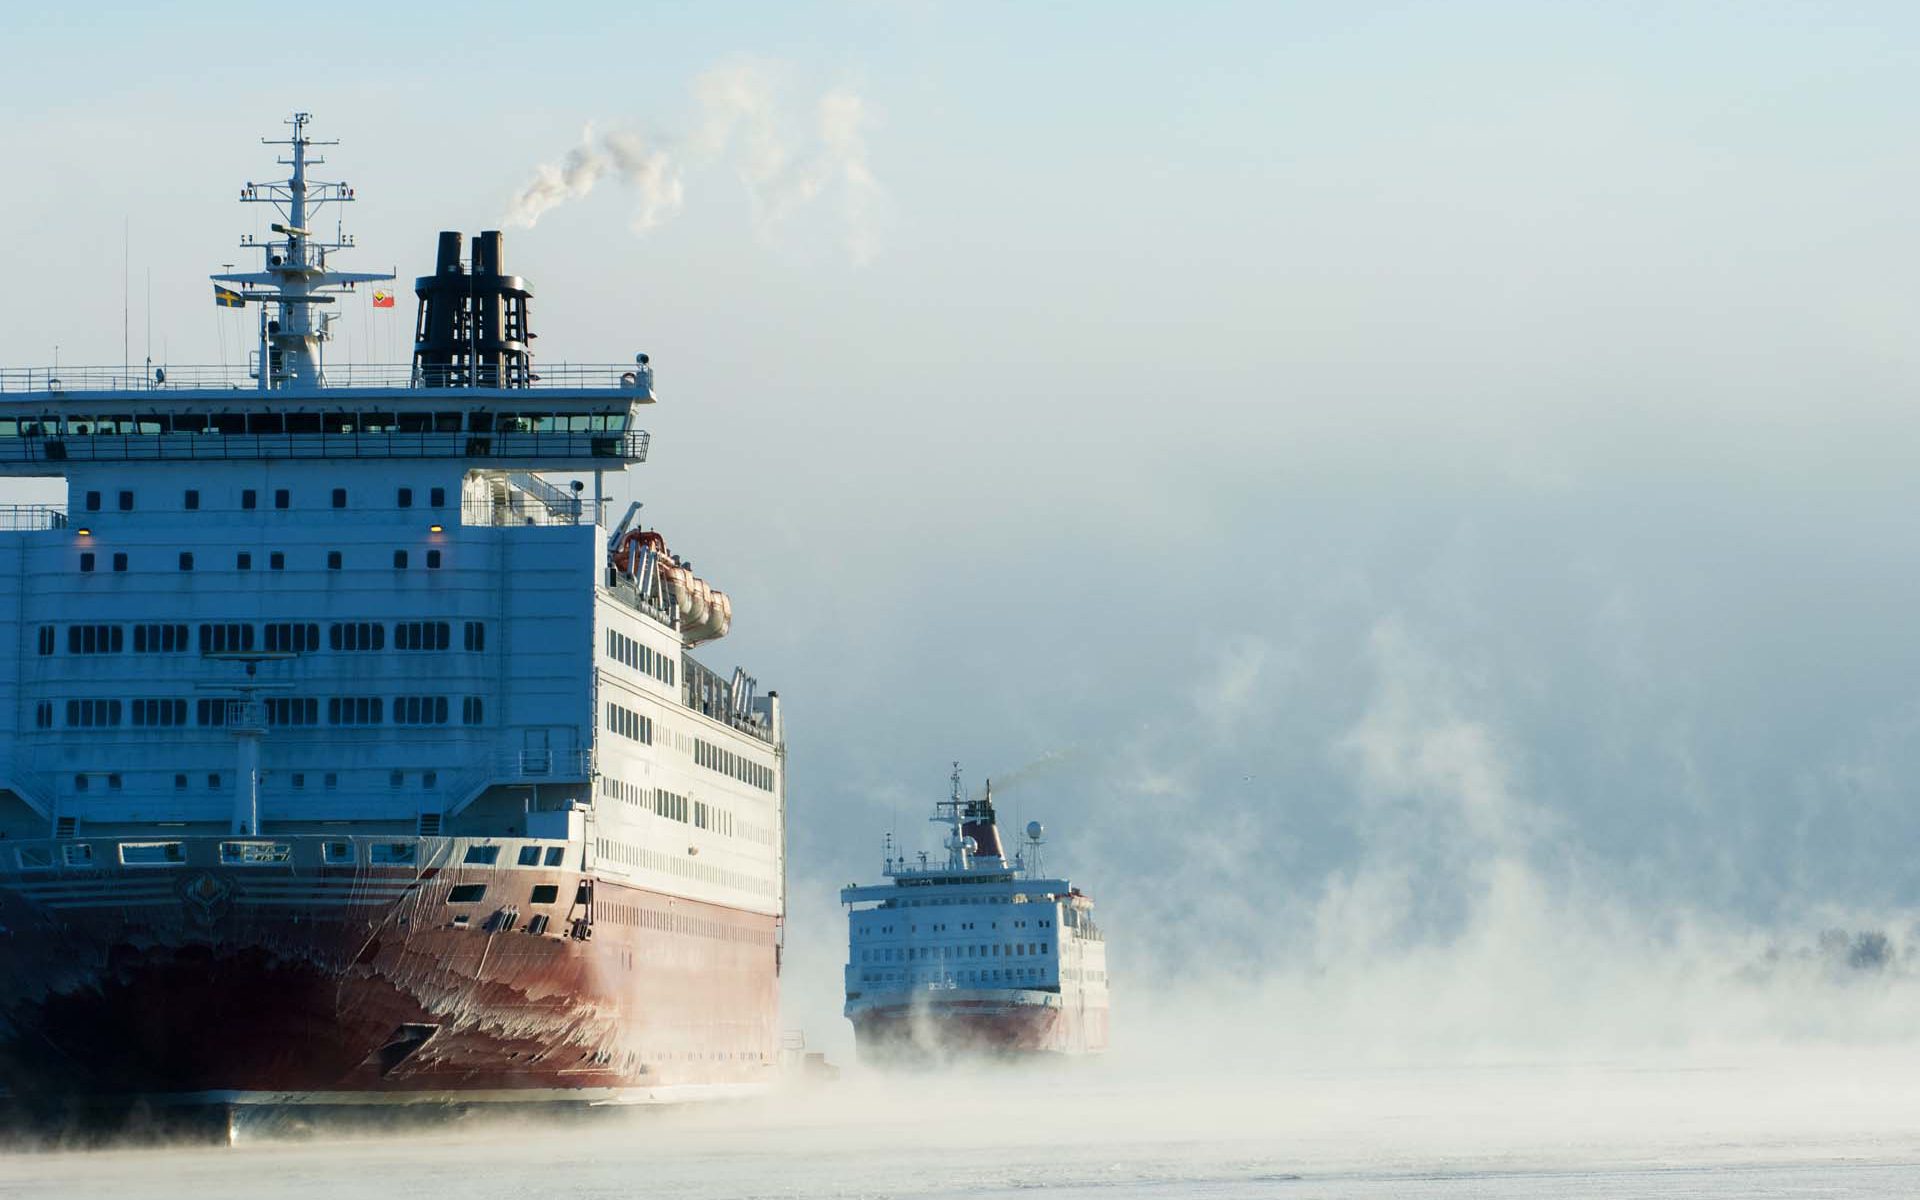
Satellite-derived bathymetry for nautical navigation

Satellite-derived bathymetry

The challenge:

Greenland Pilot Service provides navigational safety services in the Arctic region and their strategy is to contribute to a safe development of the cruise industry in polar regions.

They embark experienced and licensed Polar Code Compliant Pilots on board the cruise vessels. The Pilots contribute with local knowledge and experience, to strengthen the bridge team, ensuring a safe and effective operation.

The 24/7 manned operations center in Nuuk carries out all mandatory Risk Assessments, and continuously updates the pilots with daily information on weather and ice.

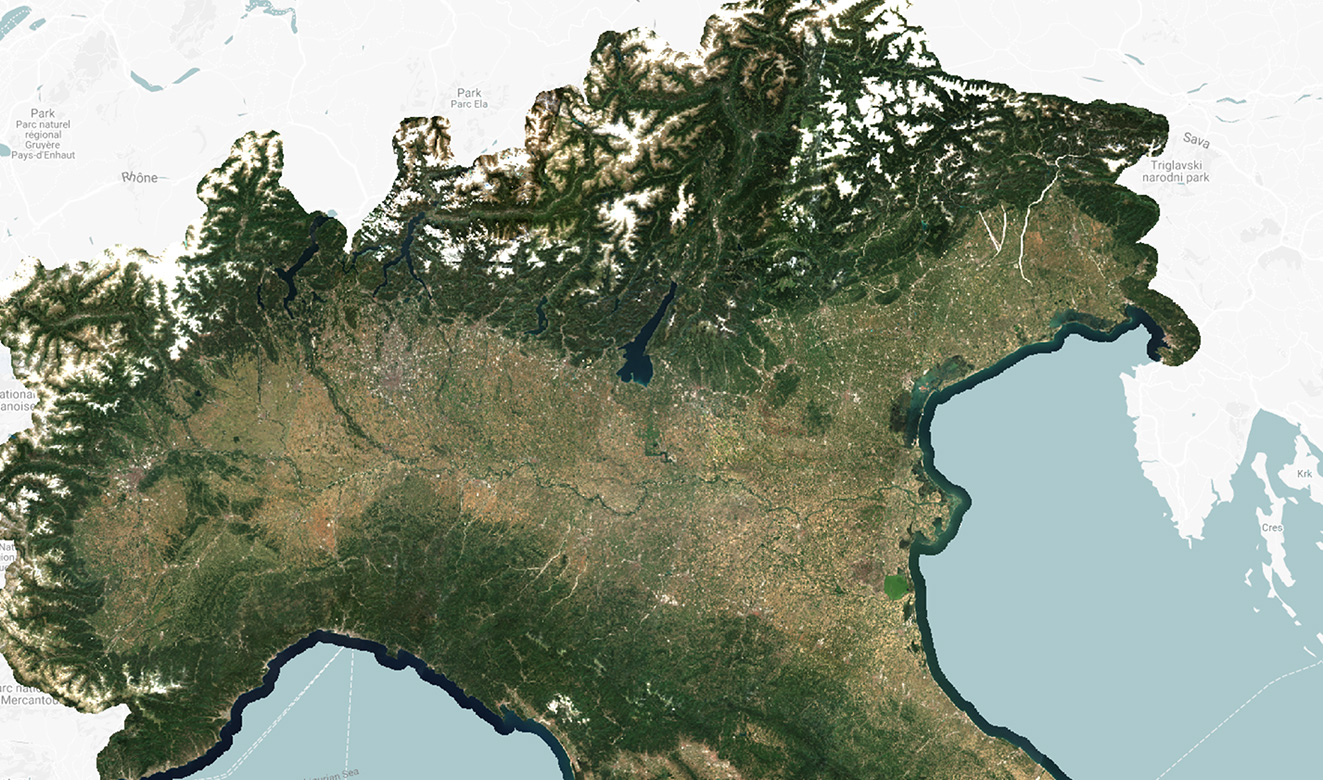
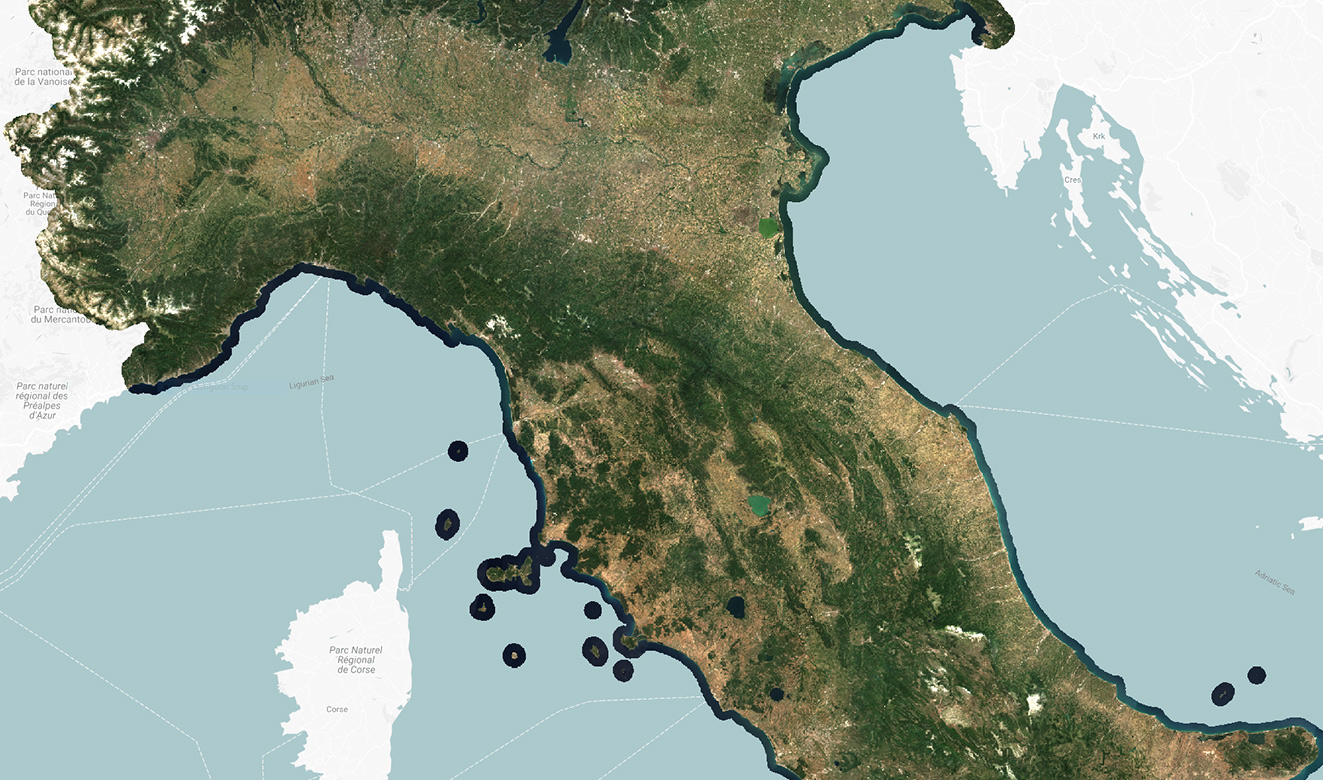
To be able to operate safely and ensure best practice, they needed updated information about coastlines and submerged hazards in the poorly charted shallow coastal area around Skjoldungen, Greenland.

Project highlights:

Updated and accurate mapping of coastlines including at high and low tide

Location and size of submerged hazards mapped with clear depiction of small and large submerged hazards

Updated spatial information ensuring safe transport of vessels, ideal for large and remote areas

Project Manager,
Thomas Bøggild

With the help of satellite-derived bathymetry from DHI GRAS we were able to make a proper navigational risk assessment enabling our clients to safely access the remote and poorly charted waters around Skjoldungen. DHI GRAS did a great job in helping us understand the value of the data and delivery was fast and on time

In more detail..

We were commissioned by the client to provide them with accurately mapped coastlines at both low and high tide, as well as identify submerged hazards, such as reefs, rocks and sand banks.

Sentinel images provided the raw data, which were then analysed and validated. The information derived from satellites is much more accurate than existing nautical charts in the Arctic and allowed Greenland Pilot Services to safely enter the waters around Skjoldungen.

A pilotage company specialised in assisting masters and navigators in their operations in Polar regions.

They carry out mandatory risk assessments and contingency planning according to relevant laws and regulations as well as voyage planning while ensuring compliance with the Polar Code.

EOatDHI part of the DHI GROUP

gras@dhigroup.com
+45 4516 9100

Agern Alle 5,
2970 Hørsholm,
Denmark

CVR: 36466871

Your geodata on the web

geodata

Why is this important?

Easy access and visualization of geodata is as important as the actual analysis and processing of the data itself. We build modern and intuitive web apps that fit your needs, whether it’s an internal tool for your analysts to query data, or a simple and elegant app for visualizing results.

The solution can be based on tried and true analysis methods or modern AI and machine learning. Our analysts and software developers work together to transform it into an algorithm which can be deployed operationally. We automate the entire pipeline, from acquisition to analysis and visualization.

The highlights:

An algorithm built to solve your exact problem

A modern and elegant web app custom-built to suit your end-users

A modern and elegant web app custom-built to suit your end-users

In more detail..

We build entire geodata web solutions into one package. Data acquisition from relevant sensors and satellites, analysis using our state of the art algorithms and AI, all the way to displaying the data in a custom-built web app, using our own open source raster server.

At DHI GRAS we have experts in both geodata analysis, software- and web development. We leverage this to provide you with a full package solution. We aim for full automation, seamlessly streaming results to your app as soon as they are processed.

EOatDHI part of the DHI GROUP

gras@dhigroup.com
+45 4516 9100

Agern Alle 5,
2970 Hørsholm,
Denmark

CVR: 36466871

Wetland Monitoring with Earth Observation Data

wetland monitoring

Why is this important?

The project has demonstrated how Earth Observation (EO) can support wetland monitoring in Uganda and with continued training sessions can become a valuable tool for wetland managers and practitioners, not only in Uganda, but potentially also paving the way for other East African countries to achieve a wetland inventory in the future.

The highlights:

Delivering a toolbox for wetland inventory mapping and demonstrating how Earth Observation can provide a full national wetland inventory in Uganda

Online portal for SDG reporting on SDG indicator 6.6.1 on wetland extent

Training national stakeholders in Uganda, and other RAMCEA countries, and providing a “lessons learned” and “roadmap” document for roll-out of the method, toolbox and online portal to other RAMCEA countries

In more detail..

The project was a unique demonstration of the full implementation of using Earth Observation to support the monitoring of wetland ecosystems on the national scale in Uganda.

Wetland monitoring is crucial for conservation and restoration of wetland ecosystems in Uganda which is explicitly mentioned in the national development plans. Hence, monitoring and reporting is not only important for reporting on the Sustainable Development Goal indicators, but should be anchored within and used by the national agencies to avoid further degradation of wetlands.

Within this project, a national baseline mapping of wetlands in Uganda was performed for 2016-2017 using all available Sentinel-1 and Sentinel-2 imagery to act as a baseline for SDG indicator reporting.

This also included a training component with three training courses, leveraging the GlobWetland Toolbox for doing national-scale wetland mapping and the inclusion of field data for classifier training and product validation, where the engagement of the local stakeholders and experts are key.

The open source toolbox provided to the local stakeholders consists of a specific component producing statistics and reports for SDG reporting which can be used by e.g. the Uganda Bureau of Statistics who are responsible for the SDG indicator reporting at the national level.

This is available from the online portal where the data, statistics and reports can be explored by users and agencies.

One of the other key aims of the project was to use the implementation in Uganda as demonstration case for uptake of the tools and methods by the other RAMCEA member countries. This was obtained through participation of key staff from the other RAMCEA countries in the training workshops, and by delivering guidance documents on “lessons learned” and “roadmap” for a roll-out.

The online portal for the project is now operated by the Ministry of Water and Environment in Uganda.

EOatDHI part of the DHI GROUP

gras@dhigroup.com
+45 4516 9100

Agern Alle 5,
2970 Hørsholm,
Denmark

CVR: 36466871

Coastline Mapping

coastline mapping

Why is this important?

Coastal zone managers and port authorities have an advantage when they have access to information about the changes and trends in their coastal area.

Coastline mapping is a solution that uses satellite images and historical archives dating back to the 1960s with the option to combine with existing aerial photographs.

The highlights:

Archives dating back to the 1960’s and recent satellite data provides coastlines that are delivered in ready-to-use vector data format

The coastlines can be derived down to a map scale of 1:1.000, with spatial details of 0.5m to 30m, and comes with flexible options accommodating varying budgets and specifications

Digital maps of the entire coastal zone can be produced with embedded information such as vegetation, sediment, coastal protection, constructions etc.

In more detail..

DHI GRAS has profound experience in mapping coastal erosion and stability classification and with our expertise in this field we can tailor a solution that works for you.

Based on historical satellite data dating back to the 1960’s we can assess and quantify erosion/accretion changes over time. Methods used for extracting coastlines are typically semi-automatic object-based segmentation depending on the nature of the coast and the details needed in the final products.

Further classification of the coastal zone can be derived based on the timeseries of satellite data to extract information about dynamics and development of vegetation, coastal protection, constructions etc.

Tidal information can be considered by adding corrections based on DHI tidal models.

coastline mapping

EOatDHI part of the DHI GROUP

gras@dhigroup.com
+45 4516 9100

Agern Alle 5,
2970 Hørsholm,
Denmark

CVR: 36466871

Flood and drought monitoring and prediction

Flood monitoring

Why is this important?

Flood and drought monitoring provides access to the right data and information for governments and local authorities. This enables them to mitigate potential disasters.

Project highlights:

Reliable near-real-time remote sensing data and climate forecasts for flood and drought management on country and river basin scale

Automated data streams from a wide range of online sources for satellite-based rainfall, temperature, soil moisture, NDVI, water levels, chlorophyll, evapotranspiration, and more

Statistics and complex indices based on latest science that support in-depth analysis of severity of flooding and drought events

In more detail..

Increased floods in some areas and droughts in others, is having a substantial impact on the ecosystem and agriculture of the affected region and harming the local economy, often hitting developing countries the hardest.

The Flood and Drought project is working on a groundbreaking online system containing an array of data such as hydrographic, meteorological and demographic information in near-real time piloted by 10 water authorities across six countries and three transboundary river basins. This is a packaged solution providing not only data and information but also tools to integrate this information into the users planning.

The online portal allows for the users to locate and identify hazards, estimating impacts and providing risk assessment. It also includes a water indicator tool and water safety planning to support decision making as well as an application to understand crop yields.

To make the information accessible to stakeholders, we maintain data streams from more than 20 different online sources of remote sensing and climate data.

We compute statistics and complex indices based on latest science for enhanced assessment of flood or drought severity, available on country or river basin scale.

The software is developed as part of the Flood and Drought Management Tools project funded by the Global Environment Facility (GEF) together with the United Nations Environment Programme (UNEP) and the International Water Association (IWA).

Related items

AI4Water: Evapotranspiration

Satellite-based evapotranspiration for improved crop water efficiency in Uganda. Using Artificial Intelligence to assess evapotranspiration, saving up to 30% in irrigation consumption

Read More

SEN-ET

SEN-ET is the Estimation of evapotranspiration based on the Sentinel satellites. By providing insight in

Read More

EOatDHI part of the DHI GROUP

gras@dhigroup.com
+45 4516 9100

Agern Alle 5,
2970 Hørsholm,
Denmark

CVR: 36466871

Updated satellite-based maps of Greenland

satellite map greenland

Why is it important?

The new cartographic data will contribute to supporting Greenland’s infrastructure management as well as its economic development.

Precise and detailed maps are also important in connection with climate and environmental monitoring, rescue preparedness and business development.

Project highlights:

Procurement of satellite imagery and Digital Elevation Models covering 85.000 sqkm of Greenland

Facilitating topographic mapping of a large and remote area with high accuracy and without risks or need for mobilization

Independent advice and experienced support selecting the right satellite-based solution for the project purpose, based on close to 20 years of experience

The Danish Agency for Data Supply and Efficiency (SDFE) has produced a short video presenting their new 3D-panorama service, based on our data.

In more detail..

Since 2015, DHI GRAS has supported the Danish Agency for Data Supply and Efficiency (SDFE), in close cooperation with Greenland’s Government, in their mission to provide updated topographic maps of the ice-free areas of Greenland. The current topographic maps of Greenland are outdated and due to the large size of the country, it is not the easiest to map.

Together with our close partners at Airbus Defence and Space we have provided ready-to-use orthomosaics and detailed Digital Elevation Models (DEM) for an area covering 85.000 sqkm of Greenland.

The satellite data products were produced based on dedicated image acquisitions of up-to-date stereo satellite imagery from the SPOT 6 and 7 satellites.

Danish Agency for Data Supply and Efficiency:

The Danish Agency for Data Supply and Effeciency (SDFE) provides high-quality data to the public and private sectors, enabling them to make important community decisions on the best possible basis.

They are a workplace that spans widely and is part of the Danish Ministry of Climate, Energy and Utilities.

Related items

EOatDHI part of the DHI GROUP

gras@dhigroup.com
+45 4516 9100

Agern Alle 5,
2970 Hørsholm,
Denmark

CVR: 36466871

Consultancy for the European Environmental Agency

GIS consultancy satellite

How we helped:

DHI GRAS provides expert assistance to assist the implementation of various activities pertaining to the Copernicus Land Monitoring Service (CLMS) managed by the EEA, including; technical support to produce Pan-European high-resolution mosaics; methodological and analytical support to review the readiness and uptake potential of the Data and Information Access Services (DIAS); management support to assist the EEA in managing the production contracts pertaining to the 2018 reference year update of the High Resolution Layers (HRL’s); onsite support to provide the technical staff at EEA with dedicated software routines easing their work with quality assurance of Copernicus Land products by on-site and customized training in GIS and Remote Sensing software.

Project highlights:

Providing on site consultancy support within processing and analysis of satellite images and other geospatial data

Development of dedicated and automated software procedures for handling and dissemination of large volume of image data

Production of high-resolution image mosaics and quality assurance of Pan-European Copernicus products such as hydrological layers, land cover maps and Digital Elevation Models

In more detail..

The framework agreement with the European Environmental Agency (EEA) covers consultancy services within Geospatial Information Systems (GIS) and advanced image processing of satellite imagery.

We were contracted to support the EEA with advanced image analysis and automation of tasks related to the handling of Copernicus land products, including production of pan-European high resolution Mosaics and methodological support for deriving deep learning approaches to extract small landscape features from very high resolution satellite images.

For this we provided on-site support for advanced image analysis including handling of large volume raster datasets, geometric corrections, image classifications, supervised and non-supervised classifications, data integration, publishing of web-services, mosaicking, image catalogue maintenance and so on.

We also provide analytical support to assess DIAS readiness for CLMS data integration and management support to facilitate the seamless production of the 2018 reference year high resolution layers.

High resolution mosaic covering the EEA39

European Environmental Agency:

The EEA is an agency of the European Union (EU), tasked with the provision of sound, independent and reliable environmental information.

The EEA undertakes important work related to the European Copernicus programme – previously known as Global Monitoring for Environment and Security (GMES).

The GMES/Copernicus (2011-2013) Initial Operations of the land monitoring service (or ‘GIO’ land) prioritise multi-purpose information common to a large user community.

EOatDHI part of the DHI GROUP

gras@dhigroup.com
+45 4516 9100

Agern Alle 5,
2970 Hørsholm,
Denmark

CVR: 36466871

Earth Observation for the Sustainable Development Goals

Earth observation sustainable development goals

Why is it important?

In 2017, the global indicator framework (232 indicators) for the Sustainable Development Goals and targets of the 2030 Agenda for Sustainable Development was adopted by the United Nations, with the aim of monitoring progress, inform policies and ensure accountability.

However, data collection and information management processes are burdensome and many countries are challenged by fulfilling the required monitoring and reporting for the SDG framework.

The potential of Earth Observation techniques to address some of these issues are clear, but undersold, and the EO for SDG-project aims to maximize the contribution of EO data to the SDG agenda by producing targeted high-quality indicator monitoring guidelines and effective outreach material, and by showcasing the usability of EO data in country demonstrations studies in dialogue with UN stakeholders.

Project highlights:

Exploiting technology improvements of Earth Observation data and services to underpin the monitoring and reporting framework of the SDG’s

Supporting national stakeholders in applying EO based techniques to support, and extend, existing monitoring and reporting capabilities and promote the benefits of integrating EO in the SDG monitoring framework

Increasing uptake and awareness of EO services in support of the SDG’s to inform decision-makers about the added value and benefits of EO-based monitoring and reporting minimum impact

In more detail..

The Earth Observation for the DHI (Denmark), GeoVille (Austria) and the UN Environment World Conservation Monitoring Centre (UNEP-WCMC, UK). The project commenced in the 1st quarter of 2018 and is expected to run for 18 months.

To increase the contribution and impact of EO data on the SDG agenda the project will deliver a range of outputs, including:

European Space Agency:

The European Space Agency (ESA) is the European space programme and its mission is to explore Earth, its immediate space environment, our Solar System and the Universe.

ESA also works closely with space organisations outside Europe to develop satellite-based technologies and services, and to promote European industries.

EOatDHI part of the DHI GROUP

gras@dhigroup.com
+45 4516 9100

Agern Alle 5,
2970 Hørsholm,
Denmark

CVR: 36466871

SeaStatus – Sea and coast monitoring

Sea and coast monitoring

Why is it important?

Seas and coasts are considered key drivers of the economy (Blue Growth) by EU and OECD. Through sustainable exploitation of the marine ecosystem, we ensure a continued contribution to human welfare, instead of overexploitation leading to severe consequences for the natural capital.

The key to a sustainable human exploitation of marine resources is precise knowledge of existing conditions and accurate predictions of anthropogenic pressures. Sea and coast monitoring provides valuable insights for all actors involved.

Project highlights:

Developing novel algorithms to derive water quality information and map marine habitats from Copernicus data in high spatial and temporal resolution

Novel and traditional measurement techniques and data processing algorithms are combined with models allowing for a continuous update of the environmental status and improvement of management practices

SeaStatus will develop a range of decision support tools for intelligent marine ecosystem management allowing for optimal use of marine resources at minimum impact

Sea and coast monitoring

In more detail..

SeaStatus combines innovative monitoring with new models for decision-making to support sustainable exploitation of the marine environment by improving the knowledge base and predictability of management scenarios.

SeaStatus addresses the entire value chain from data acquisition, quality assurance, data integration and assimilation (DA) and embeds the developed methods into robust ICT tools (data processing & integration, modelling) readily available for consultants and authorities for new EIA services and efficient and sustainable ecosystem management tools, products and services, which are unavailable today.

The project is funded with 10 mio. DKK from the Danish Innovation Fond (IFD) and runs from 2017 - 2020.

DHI GRAS is contributing to this by:

Innovation Fund Denmark:

The overall aim of Innovation Fund Denmark is to support the development of knowledge and technology, including advanced technology, in order to strengthen research and innovative solutions that may benefit growth and employment in Denmark.inno

EOatDHI part of the DHI GROUP

gras@dhigroup.com
+45 4516 9100

Agern Alle 5,
2970 Hørsholm,
Denmark

CVR: 36466871

Mapping submerged coastal vegetation

submerged coastal vegetation

Why is it important?

Marine habitats are important regions for life in the coastal zone. It is one of the key indicators of ecological status and environmental state of water bodies and therefore widely used in reporting related to e.g. the EU Water Framework Directive and the Birds Directive and as input in Environmental Impact Assessments (EIA’s).

With this project a first-ever complete baseline of the spatial distribution will be created which will allow for a future assessment of any changes in submerged coastal vegetation.

Project highlights:

Using satellite data, machine learning and radiative transfer modelling to accurately extract detailed information about marine habitats

Integration of various data sources (in-situ, satellite and models) to provide a more complete and holistic description of the coastal zone

Project outputs will be made openly and freely available providing a baseline for future assessments of changes in the ecological status on national to local scale

In more detail..

DHI GRAS has been awarded a grant from the VELUX FOUNDATION to conduct a first-ever nationwide mapping of the submerged coastal vegetation (eelgrass and macroalgae) in Denmark. Based on advanced radiative transfer modelling and machine learning techniques, optical satellite data is used to create a 10 m national map of these important coastal habitats. The project runs from 2018 to 2019.

The results will be made publicly available to stakeholders active in the coastal zone, including authorities, coastal planners, engineering companies and environmental consultants.

The free and open access approach is part of an active wish from the VELUX FOUNDATION and "DHI GRAS to expand our knowledge of the coastal zone processes and environmental state.

These are the core elements of the project:

In 2018, VELUX FONDEN granted approx. EUR 35 million. ​VELUX FONDEN (a part of THE VELUX FOUNDATIONS) is a philanthropic foundation that supports scientific, cultural, social and environmental purposes.

Furthermore, the foundation supports projects relating to active senior citizens and research in gerontology and ophthalmology. All grant areas share the purpose of promoting the democratic society of Denmark on an informed, inclusive and sustainable basis.

EOatDHI part of the DHI GROUP

gras@dhigroup.com
+45 4516 9100

Agern Alle 5,
2970 Hørsholm,
Denmark

CVR: 36466871