Preparing for the future of the Common Agricultural Policy

Preparing for the future of the Common Agricultural Policy :​

06 February 2019

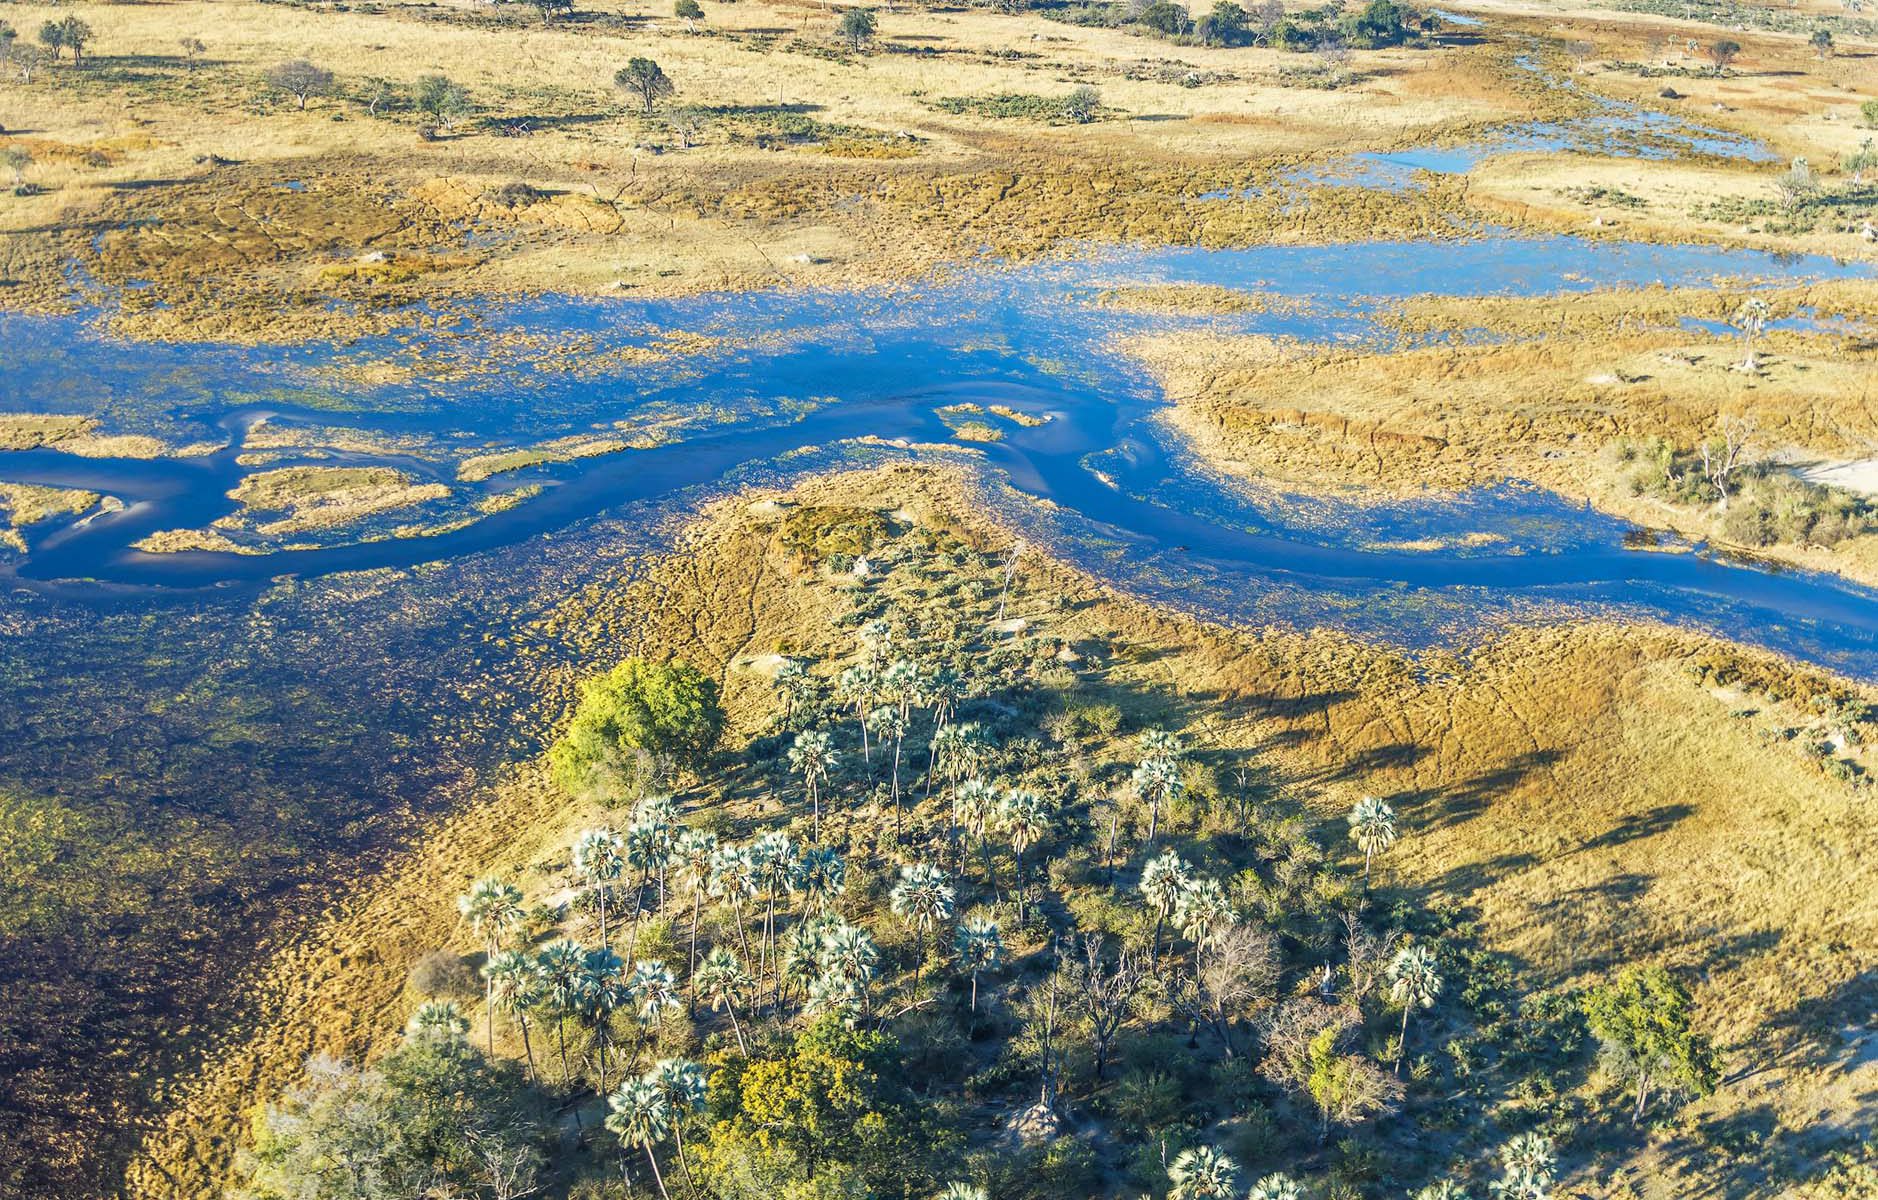
An example of satellite-based catch crop monitoring in Denmark

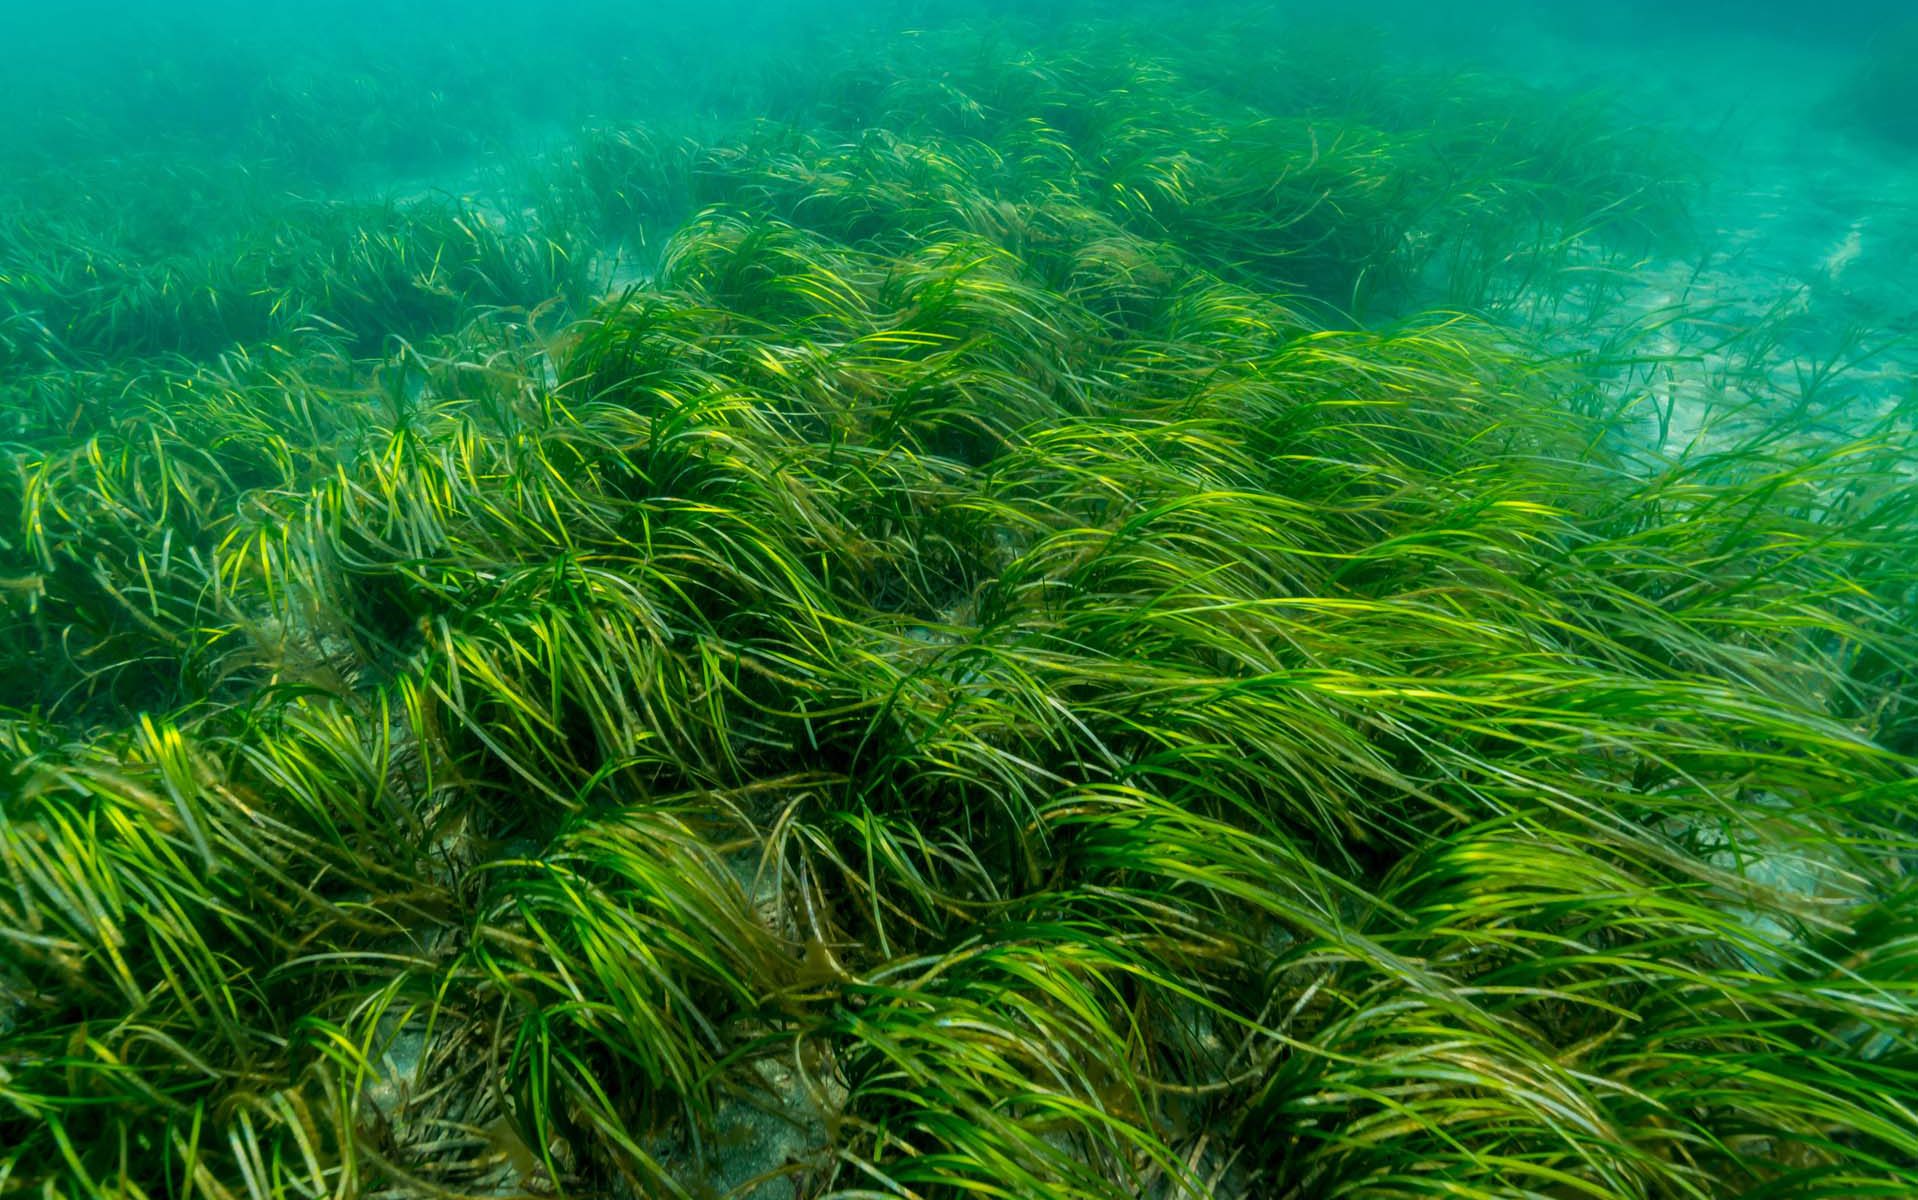
Growing catch crops after main crops is considered an important management practice for the resilience and long-term stability of agricultural cropping practices. Catch crops are non-profit crops planted a few weeks after the harvest of the main crop and before the next one is sown. This practice imitates the natural ecosystem by preserving soil nutrient resources such as nitrogen and phosphorous, increasing soil fertility and carbon sequestration, and reducing soil erosion.

In Europe, catch crops are part of the second pillar of the Common Agricultural Policy (CAP), an agricultural subsidy system for farmers, where farmlands of more than 15 hectares generally have to designate 5% of the arable land as “ecological focus areas” in order to comply with the provision. Growing catch crops such as fodder radish, yellow mustard and different grasses are one way to live up to this requirement.

EU regulations provides rules for the financing of CAP expenditure and for relevant management and control systems, requiring Member States to put an integrated administration and control system in place for the management of most of the EU agricultural spending. In Denmark, this is managed by the Danish Agricultural Agency (DAA), whose work involves many field-based controls and heavy administrative burdens.

Agricultural monitoring using satellite-based information serves as an efficient supplement to monitoring efforts performed by national agencies. At DHI GRAS, we have completed several projects for the DAA with promising results.

Our latest study focused on catch crop monitoring and maize harvest detection

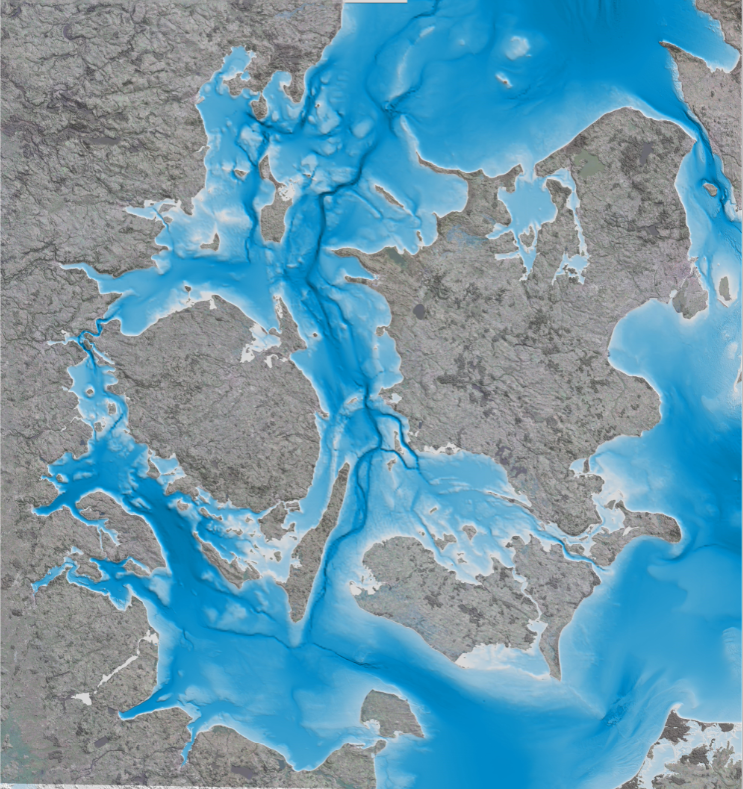
One of the major challenges to large area monitoring using satellite imagery is that the data is highly irregular in time. For example, any two fields in Denmark will have very different imagery available, due to different orbit overpass times over each field, and because of gaps caused by cloud cover. To solve this challenge, we developed innovative processing techniques so that all available cloud-free imagery over Denmark can be used seamlessly in machine learning algorithms that can accurately map catch crops.

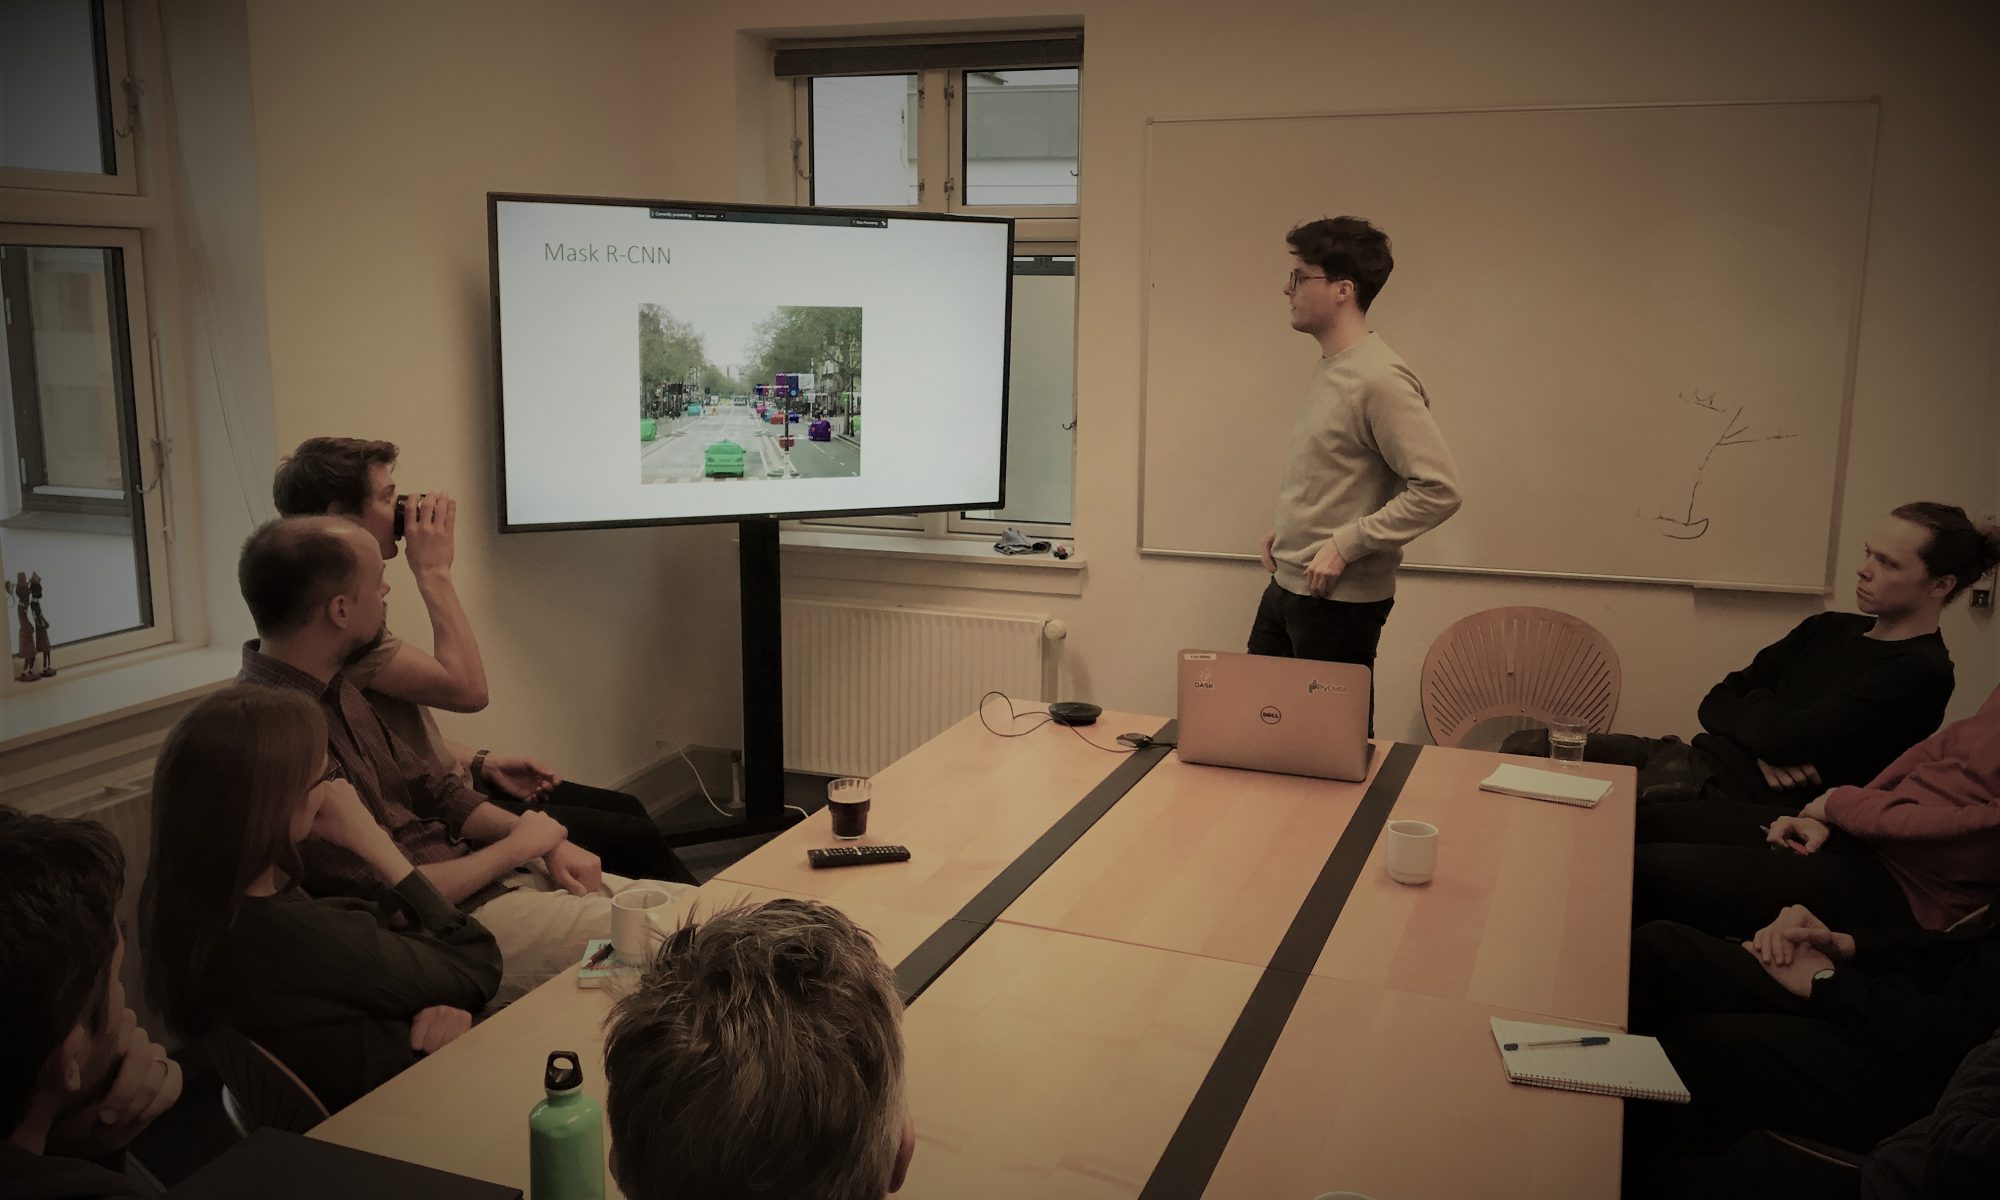
We tested a number of advanced machine learning and deep learning methods to optimize processing time and mapping accuracy – gathering valuable knowledge of current technological capabilities and which areas require further methodological development.

We’ve found great potential in using satellite imagery in connection with the agricultural industry especially for farmers, who can look forward to less paperwork and fewer control visits by the DAA.

Although information from satellites cannot completely replace field visits, it can be used to indicate to the DAA where they should focus their field visits.

By using satellites, we are taking a natural step towards the future of agricultural monitoring and are making the first experiences which over time will make it easier to live up to CAP regulations, both as a farmer and as a national agency.

EOatDHI part of the DHI GROUP

gras@dhigroup.com
+45 4516 9100

Agern Alle 5,
2970 Hørsholm,
Denmark

CVR: 36466871

Celebrating World Wetlands Day 2019

Wetland monitoring

Celebrating World Wetlands Day 2019:

01 February 2019

In celebration of World Wetlands Day on the 2nd of February 2019, and in recognition of the important role of wetlands in mitigation and adaptation to climate change, GlobWetland Africa is proud to announce the publication of several use cases on our new web viewer.

For all wetlands there is a relation to climate change. Water levels are critical to wetlands so changes in climatic conditions (e.g. the nature and variability of the wet and dry seasons, and the number and severity of extreme events) will highly influence wetland structure and functioning. But wetlands are also exposed to non-climatic anthropogenic impacts which can be amplified by climate change (e.g. drainage, water withdrawal, eutrophication, etc.).

Climatic and non-climatic drivers act synergistically causing wetland changes that can be difficult or impossible to reverse.

Better information on wetland status and trends are paramount to preserve and reverse the ongoing loss of wetlands. GlobWetland Africa can assist wetland managers and practitioners with Earth Observation data, tools and information that is needed to make informed decision for wetland conservation and restoration.

Check out the visualizations of selected use case stories here.

Wetland monitoring

EOatDHI part of the DHI GROUP

gras@dhigroup.com
+45 4516 9100

Agern Alle 5,
2970 Hørsholm,
Denmark

CVR: 36466871

The powerful combination of AI and Earth Observation Data

The powerful combination of AI and Earth Observation Data:

01 February 2019

At DHI GRAS we routinely conduct coffee talks, where our experts present their latest research and development within advanced image analytics, data science or other trends within Earth Observation.

This week our AI expert Philip Graae demonstrated results of applying Deep Learning on Earth Observation Data.

By using principles of transfer learning, we have trained a state-of-the-art object detection neural network to detect and segment small and very detailed objects within earth observation image data.

With proper tuning and by using techniques such as data augmentation, it is possible to get good results with just a small amount of training data as input to the AI.

We rely on such deep learning techniques when traditional image analytics is not sufficient to extract the information from the imagery.

Contact Philip Graae or gras@dhigroup.com for more information on how our AI developments and skillsets could benefit your needs.

EOatDHI part of the DHI GROUP

gras@dhigroup.com
+45 4516 9100

Agern Alle 5,
2970 Hørsholm,
Denmark

CVR: 36466871

Flood Risk and Hazard Mapping

flood risk and hazard mapping

Why is it important?

Flood risk and hazard mapping is important for efficient flood risk management. The flood maps are used to prevent flood damages, for land use planning and rescue operations.

How can it help?

With satellite imagery it is possible to map the extent of an area that has been subject to either a flood or hazard, and assess the damage, getting a full overview of where aid is needed the most.

What you get!

Assess the amount of flooding in near real time by triggering satellites to map flooded areas. The flood hazard map can be acquired a few hours after flooding has occurred and delivered in less than 24-48 hours globally (different solutions apply)

Prevent or limit floods from happening again by mapping historical flood hazards to understand the risks and take mitigating actions based on time series of satellite imagery​

Using high-quality Digital Terrain Models suitable for assessing flood depth coupled with enhancement of Digital Elevation Models through advanced image analysis (feature extraction)

flood risk and hazard mapping

Typical customers?

Urban planners to manage and understand the flood risks in urban planning zones

Civil security agencies to asses the potential severity and frequency of flood losses in emergency situations

NGOs and governments to map, plan and analyse flood risk problems from local to national scales

Specifications

Satellites and our services are global

Get these type of maps daily depending on the overpass schedule of the different satellites

Get information about historical floodings depending on availability of archived imagery

The raw satellite image is typically available within hours after the image acquisition (time needed for analysis and production of maps can vary from a few hours to days depending on size of area)

Price list

Let us know in advance where and when you expect a flooding to occur and contact us for a quote!

Visit us at our flood data portal:

EOatDHI part of the DHI GROUP

gras@dhigroup.com
+45 4516 9100

Agern Alle 5,
2970 Hørsholm,
Denmark

CVR: 36466871

The bi-annual Danish Marine Research event

The Danish Marine Research event:

25 January 2019

DHI GRAS presenting state-of-the-art marine and coastal research

Today is the last day of the bi-annual Danish Marine Research event, covering state-of-the-art research within marine and coastal topics.

In the session ‘New Technology in Marine Research and Monitoring’ we presented our new high-resolution Danish bathymetry model providing a first ever full national cover of shallow water bathymetry in Denmark and the status of our 2-year activity on high-resolution mapping of submerged aquatic vegetation at national scale funded by the VELUX FONDEN.

It is clear that the acceptance of satellite-based information as a valuable tool for monitoring the marine and coastal zone is increasing and we look forward to further work on increasing the acceptance through continued delivery of high-quality services and data products.

Contact us at gras@dhigroup.com if you want to know more about how we use satellite data to monitor the coastal zone or read about the project here.

EOatDHI part of the DHI GROUP

gras@dhigroup.com
+45 4516 9100

Agern Alle 5,
2970 Hørsholm,
Denmark

CVR: 36466871

Satellite-derived bathymetry for nautical navigation

Satellite-derived bathymetry

The challenge:

Greenland Pilot Service provides navigational safety services in the Arctic region and their strategy is to contribute to a safe development of the cruise industry in polar regions.

They embark experienced and licensed Polar Code Compliant Pilots on board the cruise vessels. The Pilots contribute with local knowledge and experience, to strengthen the bridge team, ensuring a safe and effective operation.

The 24/7 manned operations center in Nuuk carries out all mandatory Risk Assessments, and continuously updates the pilots with daily information on weather and ice.

To be able to operate safely and ensure best practice, they needed updated information about coastlines and submerged hazards in the poorly charted shallow coastal area around Skjoldungen, Greenland.

Project highlights:

Updated and accurate mapping of coastlines including at high and low tide

Location and size of submerged hazards mapped with clear depiction of small and large submerged hazards

Updated spatial information ensuring safe transport of vessels, ideal for large and remote areas

Project Manager,
Thomas Bøggild

With the help of satellite-derived bathymetry from DHI GRAS we were able to make a proper navigational risk assessment enabling our clients to safely access the remote and poorly charted waters around Skjoldungen. DHI GRAS did a great job in helping us understand the value of the data and delivery was fast and on time

In more detail..

We were commissioned by the client to provide them with accurately mapped coastlines at both low and high tide, as well as identify submerged hazards, such as reefs, rocks and sand banks.

Sentinel images provided the raw data, which were then analysed and validated. The information derived from satellites is much more accurate than existing nautical charts in the Arctic and allowed Greenland Pilot Services to safely enter the waters around Skjoldungen.

A pilotage company specialised in assisting masters and navigators in their operations in Polar regions.

They carry out mandatory risk assessments and contingency planning according to relevant laws and regulations as well as voyage planning while ensuring compliance with the Polar Code.

EOatDHI part of the DHI GROUP

gras@dhigroup.com
+45 4516 9100

Agern Alle 5,
2970 Hørsholm,
Denmark

CVR: 36466871

Mapping aquatic vegetation in Denmark

submerged coastal vegetation

Mapping aquatic vegetation in Denmark:

09 January 2019

For the first time, the aquatic environment around the Danish coastline will be mapped using satellite images.

By using satellites, the task is both easier to carry out and gives a better spatial overview.

This will help to strengthen the protection of our coastal water environment.

The project has been made possible thanks to a grant from the VELUX Foundation.

Watch the video below to learn more!

EOatDHI part of the DHI GROUP

gras@dhigroup.com
+45 4516 9100

Agern Alle 5,
2970 Hørsholm,
Denmark

CVR: 36466871

Your geodata on the web

geodata

Why is this important?

Easy access and visualization of geodata is as important as the actual analysis and processing of the data itself. We build modern and intuitive web apps that fit your needs, whether it’s an internal tool for your analysts to query data, or a simple and elegant app for visualizing results.

The solution can be based on tried and true analysis methods or modern AI and machine learning. Our analysts and software developers work together to transform it into an algorithm which can be deployed operationally. We automate the entire pipeline, from acquisition to analysis and visualization.

The highlights:

An algorithm built to solve your exact problem

A modern and elegant web app custom-built to suit your end-users

A modern and elegant web app custom-built to suit your end-users

In more detail..

We build entire geodata web solutions into one package. Data acquisition from relevant sensors and satellites, analysis using our state of the art algorithms and AI, all the way to displaying the data in a custom-built web app, using our own open source raster server.

At DHI GRAS we have experts in both geodata analysis, software- and web development. We leverage this to provide you with a full package solution. We aim for full automation, seamlessly streaming results to your app as soon as they are processed.

EOatDHI part of the DHI GROUP

gras@dhigroup.com
+45 4516 9100

Agern Alle 5,
2970 Hørsholm,
Denmark

CVR: 36466871

Open-Source Software Development

Open-Source Software Development:

14 december 2018

There are countless of open source products we use and love at DHI GRAS, and it is very dear to us to give back to the community.

Therefore, we are thrilled to announce that we have just released our new, light-weight tile server Terracotta as free software under an MIT License!

Terracotta directly serves your (cloud-optimized) GeoTIFF files, so you don't need to apply any pre-processing to get your raster data online, and it supports serverless deployment on AWS Lambda, so you can serve your data without any permanent infrastructure.

We urge you to check it out, and look forward to your feedback.

EOatDHI part of the DHI GROUP

gras@dhigroup.com
+45 4516 9100

Agern Alle 5,
2970 Hørsholm,
Denmark

CVR: 36466871

AI for Earth

AI for Earth:

13 december 2018

To get more yield with fewer resources, precision is key – especially with a precious resource like water. One way to know how much water crops really need is to measure how much water evaporates from the soil and plant surfaces. This is known as the evapotranspiration (or ET) rate, which helps farmers improve their watering efficiency


Torsten Bondo: Business development manager and senior remote sensing engineer at DHI GRAS in Denmark.

His team aims to use machine learning and satellites to support irrigation development and improve crop water efficiency in Uganda together with the Ugandan geo-information company Geo Gecko. The goal is to contribute to food security, poverty alleviation and economic growth.

The project that been chosen as one of the eleven changemakers to receive the Microsoft and National Geographic AIforEarth Innovation Grant.


EOatDHI part of the DHI GROUP

gras@dhigroup.com
+45 4516 9100

Agern Alle 5,
2970 Hørsholm,
Denmark

CVR: 36466871