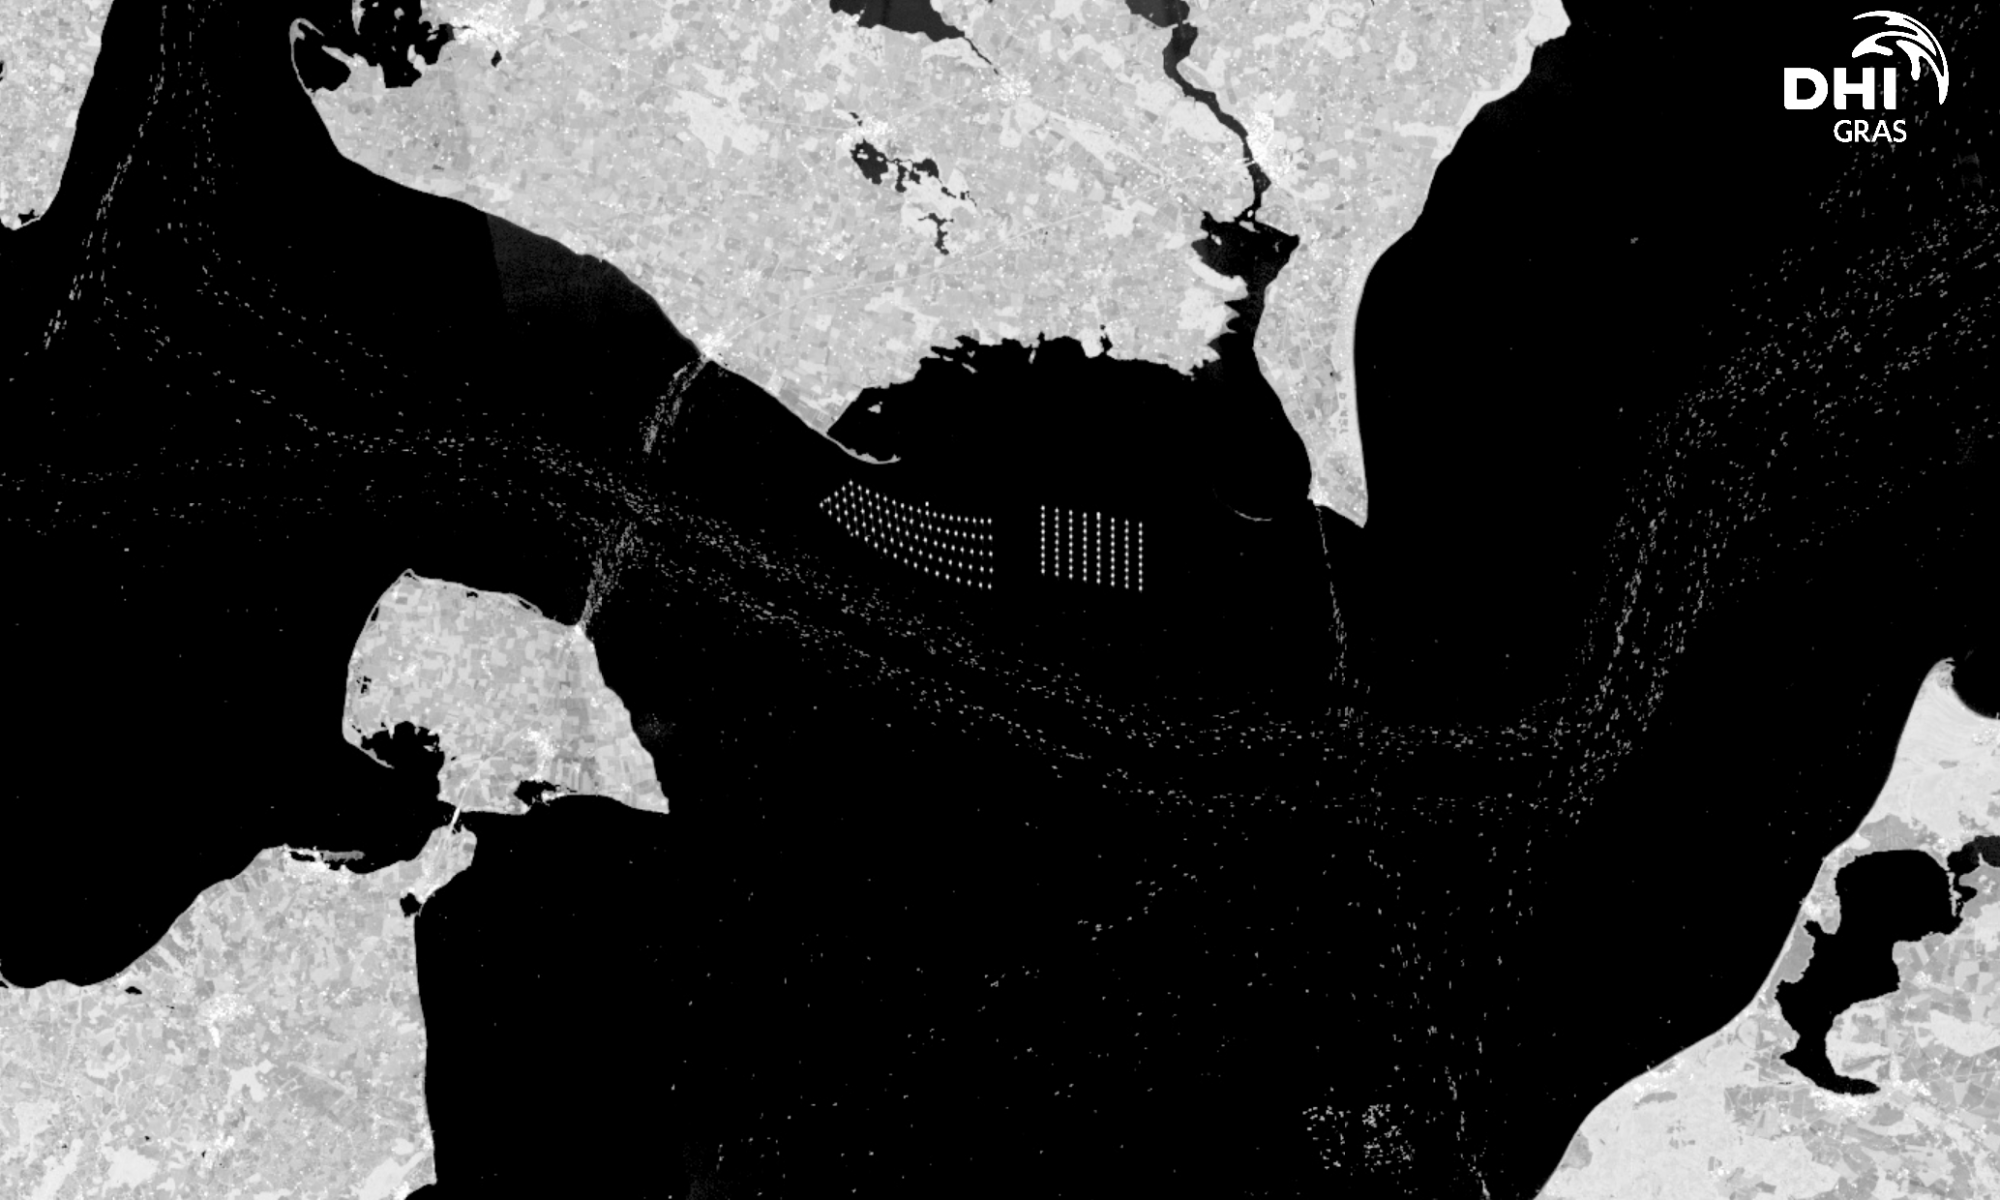
Vessel traffic patterns in the Femern Belt between Denmark and Germany captured by time series of satellite observations shows the highways at sea.
This satellite based information complements traditional sources of information such as AIS (automatic identification systems) and land based radar systems.
The first satellite constellation from the Copernicus Programme,
Sentinel-1, carries a synthetic-aperture radar (SAR) instrument which provides high resolution images regardless of weather conditions both day and night, making it eminent at monitoring the movement patterns of ships anywhere on Earth.
Currently more and more SAR satellite sensors are being added to space thus allowing for more frequent monitoring capabilities.
The image was created by combining over 300 Sentinel-1 images from 2017. In the image, each of the smaller dots represents a ship moving through the Femern Belt. Some offshore wind farms are also clearly visible.
DHI is greatly involved in the upcoming fixed link between Denmark and Germany, and it will be interesting to see how these vessel patterns will change in the coming years.
Copyright: DHI GRAS, contains Copernicus Sentinel data (2017).
Ever wondered what Earth Observation satellites are capable of monitoring?:
27 September 2018
Earth Observation (EO) satellites have become increasingly smaller, cheaper and easier to launch – and they are now orbiting the earth in record numbers. This is great news for the water environment as an increased number of satellites equate to more frequent and detailed data, allowing more water challenges to be solved along with the development of new remote sensing techniques.
For these reasons, and because of their preciseness in monitoring the environment and meteorology of the Earth, EO satellites are starting to grow in popularity.
They give users a good overview of large and remote areas and have the ability to compare timeseries that show the change between seasons, years and even decades. It is also a non-intrusive method to the wildlife and natural environment.
Choosing from hundreds of different applications of EO data, here are three which show the diversity and value of satellite-derived data within water environments. Read on to see how they are used for a range of purposes.
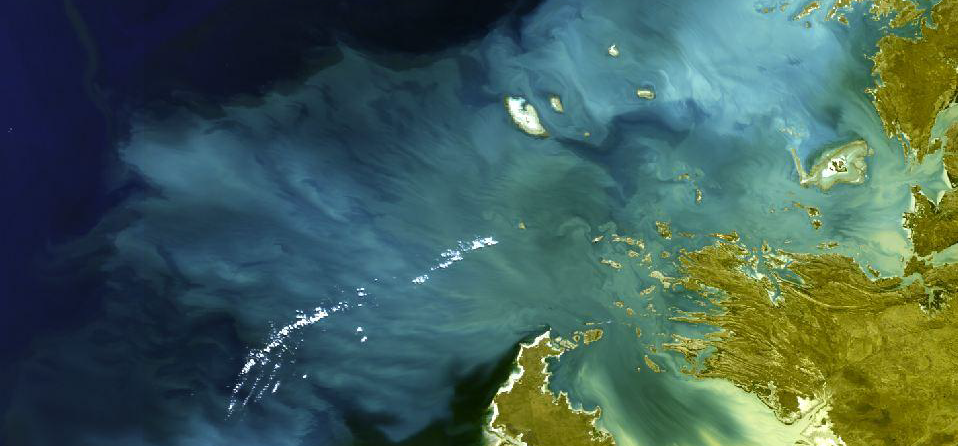
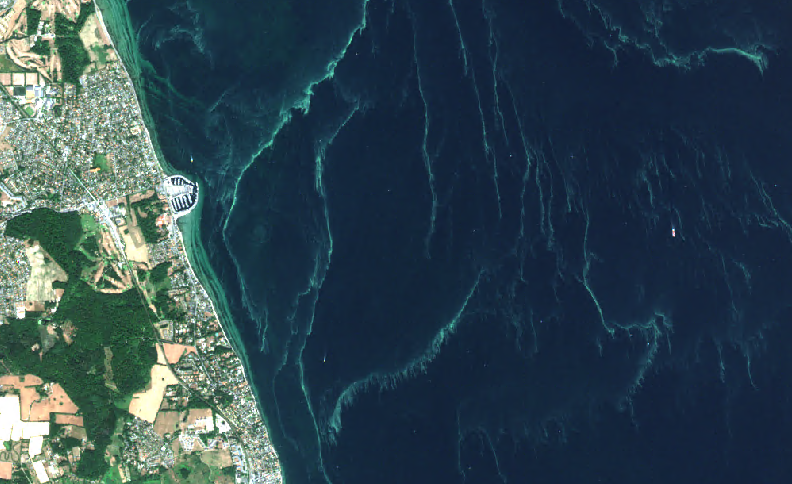
Sediment plumes
Dredging and material handling in the aquatic environment always results in a certain amount of sediment spill, which affects the surrounding environment, causing stress and damage to fauna and flora. Since the suspended matter affects the colour of the water, satellites can be used to quantify both the spatial extent and the levels of suspended matter.
Using archived satellite data dating back to 2000, it is also possible to establish the long-term baseline conditions for any region in the world. Not only does satellite data give us an accurate baseline for comparison, it also provides us with daily information of sediment levels and sources. This makes it possible for us to identify the origin of events and determine whether they are natural or man-made disturbances.
Construction activities can thereby be optimised, and overall costs reduced. At the same time, we can ensure that environmental impacts are kept to a minimum.
Case example:
The Wheatstone project in western Australia has undertaken comprehensive environmental studies and project optimisation in accordance with their Environmental Stewardship to achieve environmental approvals. Using a solution based on satellite data, they were able to identify potential dredge impacts and critical dredge scenarios. This allowed for an effective and time-saving assessment of the environmental effects caused by disturbance during construction.
Sensitive marine habitats
Shielding natural marine environments from human activities such as aquaculture production can be difficult. However, detailed mapping and consistent monitoring tools can give advice and guided support to the sustainable management of regions where the biodiversity is at risk.
Case example:
The Department of Fisheries in Australia, who were developing an aquaculture production zone, made use of satellite mapping of the submerged habitats to assess the potential impact on sensitive marine habitats. This was useful for them to understand the baseline of the hydrodynamics and marine biology of the bay.
Water depths in shallow coastal zones
It can be challenging to provide accurate and consistent mapping of water depths in shallow waters due to shifting seabed features and dynamic ocean currents. Because of this, most of the world’s coastal shallow zones remain uncharted. This is problematic for activities such as nautical navigation and exploration of the underwater environment. However, with data collected from satellites, it is possible to produce detailed and high-quality maps showing the updated water depth (also called bathymetry) in coastal zones. It is a method that is suitable for large and remote areas anywhere on the globe, and, unlike traditional hydrographic survey techniques, it does not require large investments or the associated risks to personnel and equipment.
Case example:
Greenland Pilot Service needed updated water depth maps to be able to safely navigate ships in poorly-charted waters in Greenland. With the help of satellite data, they were given information of coastlines at high and low tides, as well as the mapping of small and large submerged hazards. This greatly reduced the risk of groundings and made new areas accessible for ships.
Did you know that satellites are a great tool for monitoring water quality?
Regular testing of water quality is an important part of environmental monitoring and evaluation of the ecological status of an area.
Traditional monitoring based on in-situ sampling provide accurate point measurements but are time consuming and costly.
Incorporating satellite monitoring into traditional monitoring programs adds significant value as the satellite monitoring provides both the spatial overview and offers high temporal frequency.
Combining in-situ sampling with satellite data allows you to accurately map and quantify phenomena such as algae blooms, urban and industrial waste discharge as well as turbidity (natural and man-made).
Satellite-based water quality information combined with ecological modelling further allows us to forecast the situation at a chosen site, days in advance.
Contact us, if you want to know more about how we work with water quality monitoring.
“The portal doesn’t just provide data and information, it provides tools that allow you to integrate the information into your planning. There are other portals that provide climate data, but there aren’t any systems that provide a package allowing you to access information and then use it in your planning process.” Katherine Cross, IWA
The initiative led by UN Environment is working together with the International Water Association and DHI to enable water authorities to manage and overcome water-related risks by being able to predict and plan for flood and drought impacts. To make the information accessible to stakeholders, DHI GRAS has aggregated data streams from more than 20 different online sources of remote sensing and climate data. We compute statistics and complex indices based on latest science for enhanced assessment of flood or drought severity, available on country or river basin scale.
Access the publicly available Flood and Drought Portal here:
The Arctic is opening more and more for commercial shipping.
This year, the oldest and thickest sea ice in the Arctic has started to break up, opening waters north of Greenland for the first time. A short-cut through the Arctic is becoming possible. This allows for faster and fuel-saving routes for ships connecting Europe and Asia.
These “newly-discovered” areas are poorly charted and there is a need for updated maps of the coastlines and submerged hazards to be able to safely navigate in these waters.
We are working with authorities and the shipping industry to help reduce the risks of navigating in these areas. Based on our many years of experience working in the region we have optimized workflows for mapping satellite-derived bathymetry and navigational hazards in these harsh environments and we can provide updated maps for large and remote areas with a fast turnaround.
World Water Week is an annual event organised by the Stockholm International Water Institute (SIWI) that focuses on the globe’s water issues.
The theme for 2018 is Water, Ecosystems and Human Development.
This year DHI GRAS in collaboration with UNEP, ESA and NASA will be convening a session on using Big Data and Earth Observations for SDG 6 monitoring.
The session will take place in NL Pillar Hall 16:00-17:30 on 29 August, Wednesday. Find out more about the event and its speakers:
DHI GRAS has contributed to the new publication from UNCCD “A Better World”, which offers solutions to Sustainable Development Goal 15: Life on Land.
The work has been conducted under the European Space Agency (ESA) funded EO4SD project. Visit the site if you would like to know more about the initiative
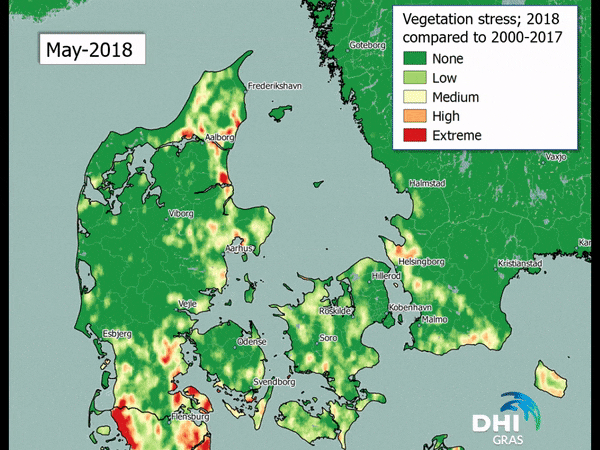
Satellite-based evidence of the abnormal dry conditions in Denmark:
10 August 2018
Copyright: DHI GRAS, contains Copernicus Sentinel data (2018)
The analysis depicts how the vegetation stress of May, June and July 2018 differ from the average ‘normal’ conditions of the same months (measured as an average of observed vegetation stress in the period 2000 to 2017). The vegetation stress is based on an assessment of the water availability where green colours indicate ‘no change from the normal conditions’ and red colours indicate ‘extreme worsening compared to the normal conditions’. Let’s break this down further.
May 2018, being mostly green, had normal conditions in most of the country if you compare it to the 18 previous years, although some parts already deviated from the average of previous years (these are the yellow to red colours you see). Moving on to June 2018 the colours have shifted, and we now see more areas affected by lack of water compared to previous years; the drought conditions are worsening and beginning to affect crops and natural vegetation. During July the picture changes completely. The heat wave and lack of rain continues and almost the entire country is now experiencing an extreme deviation from the period of 2000 to 2017 or put more simply: highly unusual and extreme drought.
These extreme deviations come at a cost. A prognosis done by a Danish agricultural journal, indicates that the expected Danish grain harvest will be more than 35% below the last five years’ average harvest. If the prognosis sticks this will give Danish farmers, the worst harvest recorded since 1976. In addition, the grass harvest for livestock fodder is expected to be halved, and the coming harvest of maize has been reduced by 25-30%; if the drought persists the output will be reduced even further.
Farmers dealing solely with livestock are also feeling the heat. The low supply of grains and other types of fodder is seeing a rise in prices which farmers are having a hard time to pay for.
All in all, this is estimated to cost the Danish agricultural sector minimum 6,4 billion Danish crowns. A government grant to help farmers is now being put in place and will among other things try to secure enough fodder for livestock and give more flexibility in relation to the sowing of catch crops. Our analysis clearly illustrates and documents the extreme conditions we have experienced this summer and that the vast majority of Denmark is affected by the ongoing lack of rain.
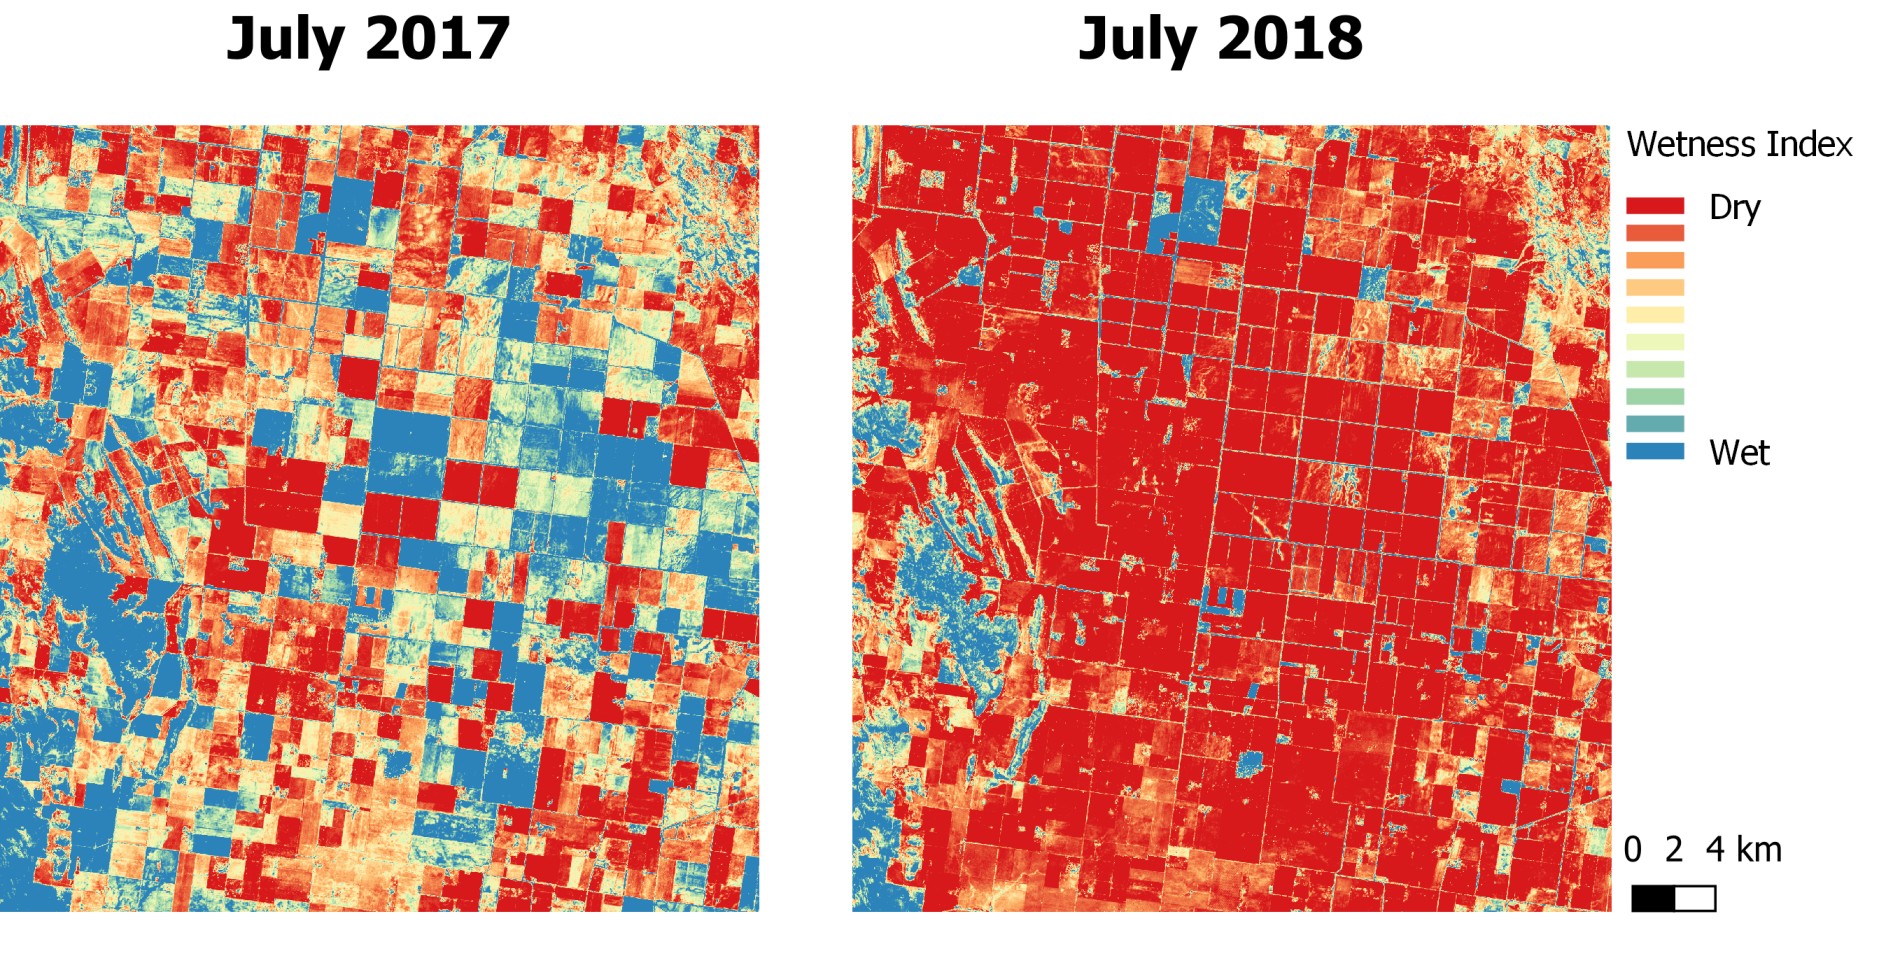
It’s not just Europe that is suffering from severe drought after several weeks of extremely high temperatures.
Australia, where it’s winter right now, is experiencing the biggest shortage of precipitation in living memory. 99% of the state of New South Wales, the country’s fourth largest provider of agriculture output, is currently in drought. The situation is so dire that total government funding for farmers has now reached $576m.
The start of the bushfire season has also been pushed forward almost two months due to next to no rain with 525 bushfires across New South Wales recorded burning last week. This is almost double the number at the same time last year.
The states rural fire service is already looking nervously towards the coming of summer.
Below Sentinel-2 images from a rural area outside of Griffith, NSW shows you the wetness index in July 2017 compared to July 2018.
Copyright: DHI GRAS, contains Copernicus Sentinel data (2018)