Coastline Mapping

Why is it important?

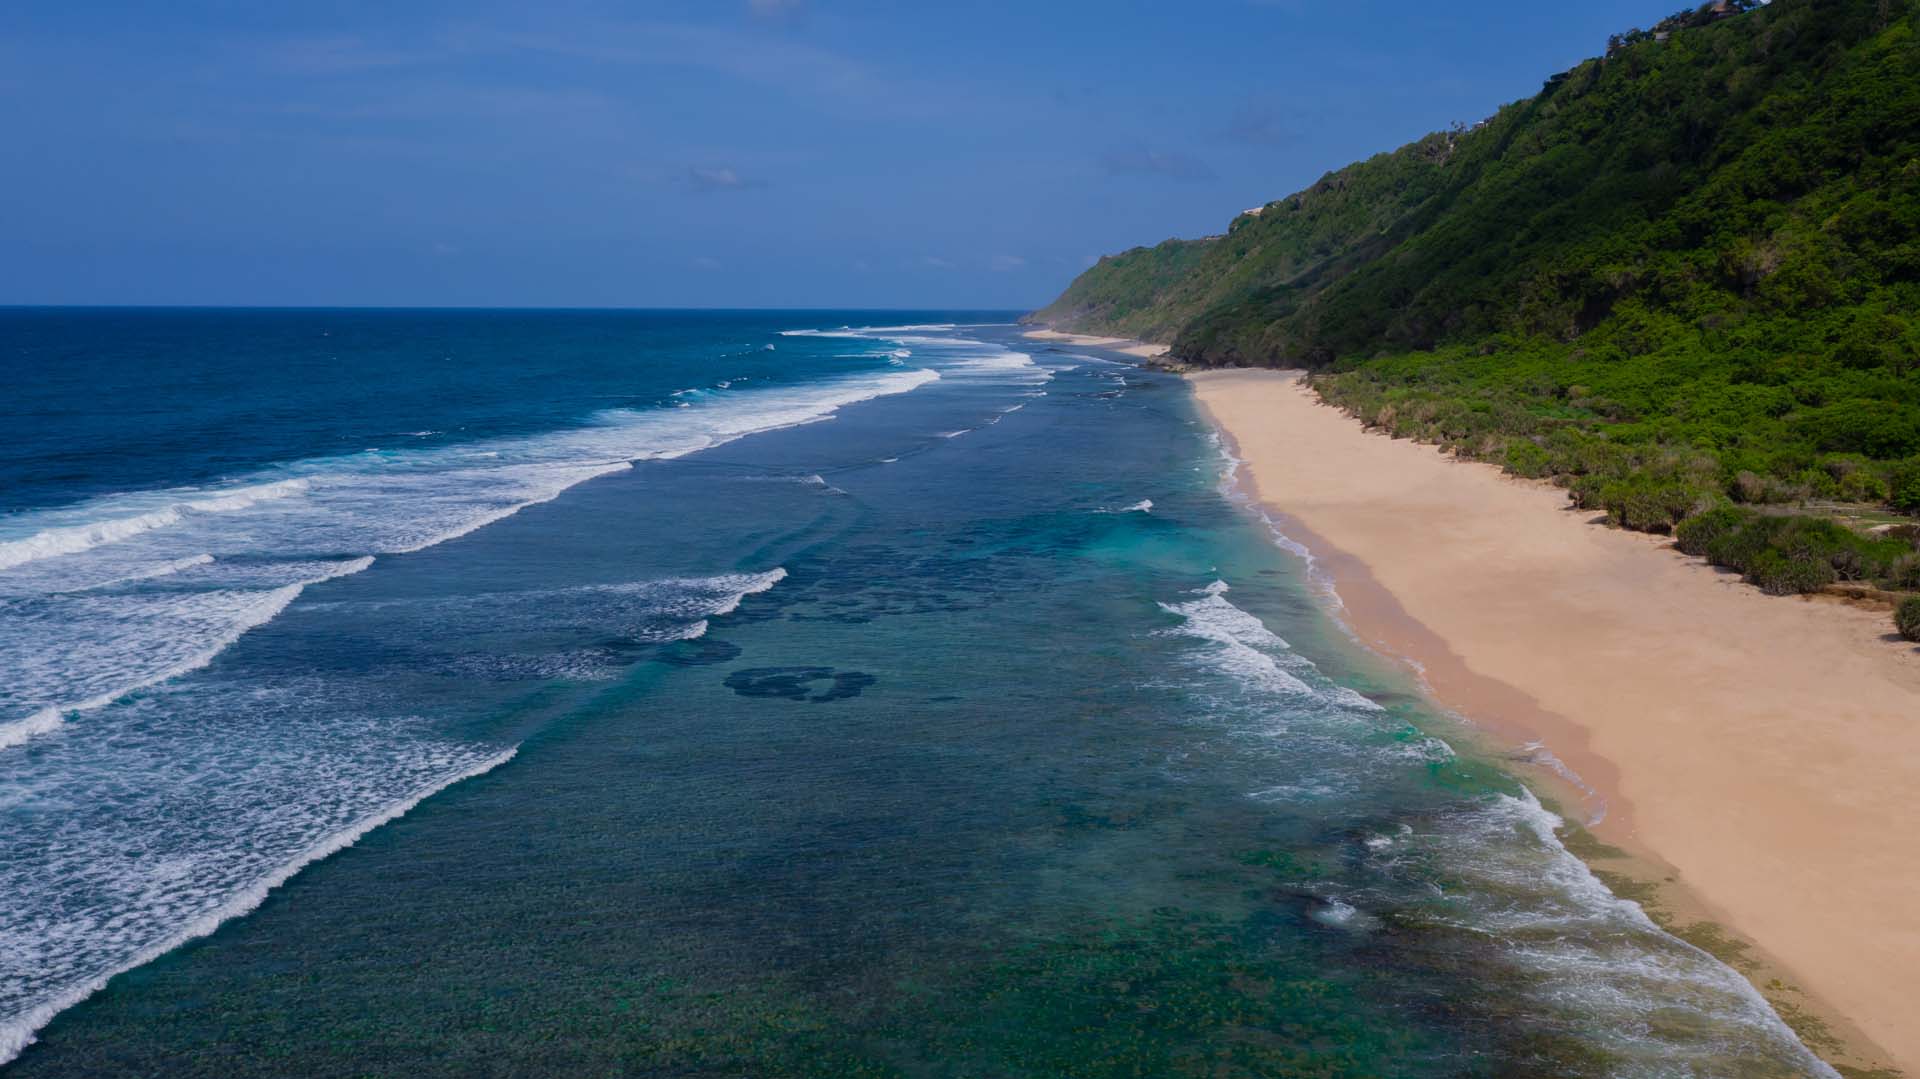
Based on historical and recent satellite imagery we can extract information about coastal dynamics, providing estimations of coastline changes (meters/year) caused by factors such as sand erosion/deposition, infrastructure developments.

Satellite data dates back to the 1960’s and provides a detailed level of information about changes in shoreline around the world. This type of analysis provides valuable information about erosion and deposition of sand and sediments, development of vegetation cover in the coastal zone and information on coastal structures and coastal protection.

How does it work?

Satellite data dates back to the 1960’s and provides a detailed level of information about changes in shoreline around the world. This type of analysis provides vulnerable information about erosion and deposition of sand and sediments, development of vegetation cover in the coastal zone and information on coastal structures and coastal protection.

What you get!

Extracted coastlines from different years or seasons provided as ready to use in any GIS or coastal modeling software

Digital maps of the entire coastal zone providing information about vegetation, sediment, coastal protection, constructions etc.

Imagery from different years with an optimized geocode allowing you to evaluate your area of interest. Images can be added into your webGIS or desktop GIS

Typical customers?

Coastal construction companies use it to document the environmental impact, for optimal site identification and to identify baseline conditions

Coastal managers use it for coastal planning and identification of areas affected by erosion or deposition, for environmental impact assessment and monitoring

Coastal zone planners and managers benefit from continuous shoreline monitoring in order to assess the coastal dynamics in near real time on frequent basis

Specifications

Coastlines are delivered in ready-to-use vector data format

Analysis of coastline changes (erosion/deposition) can be reported by meters/year or area based (m2)

The coastlines can be derived down to a map scale of 1:1.000 and comes with flexible options accommodating varying budgets and specifications

Historical coastlines can be extracted all the way back to the 1960’s 

Price list

The price for mapping of coastline dynamics depends on frequency and availability of imagery, the length of coastline, and the level of detail

Contact us for a quote

EOatDHI part of the DHI GROUP

gras@dhigroup.com
+45 4516 9100

Agern Alle 5,
2970 Hørsholm,
Denmark

CVR: 36466871

Digital Elevation Model

Why is it important?

A DEM enables you to understand all aspects of the terrain and is an essential input in many geospatial analyses such as topography mapping, hydrological modelling, airspace planning, infrastructure site planning’s and environmental change applications.

An elevation model derived from satellites will overcome challenges related to the insufficient detail level in public available DEM’s such as SRTM, as well as being a more cost-efficient alternative to LiDAR and land surveyor based DEM’s.

How does it work?

A Digital Elevation Model (DEM) is a digital representation of the earth’s terrain heights.

We provide DEM’s created from stereoscopic satellite imagery, which is a highly cost-efficient alternative to traditional land and aerial based surveying approaches. A DEM can be used to derive topographic contours and compute elevation slope, aspect and other topography characteristics used in many geospatial analyseis.

A DEM can be delivered as both a digital surface model (DSM) which includes surface features such as vegetation and man-made structures, as well as a bare-earth representation without above ground objects (DTM) – both options ranging from 50 cm to 30 m in spatial resolution

What you get!

Updated and tailormade Digital Elevation Model (DTM/DSM), delivered in any ready-to-use GIS format

Possible additional data layers such as contour lines, hydrological enhancements, satellite imagery

Our independent and qualified advice on selecting the right solution suited to your project requirements

Typical customers?

Hydrological modelers work with DEM’s for flood modelling

Aerial operators (e.g. UAV and airplane pilots) need accurate terrain heights to safely plan their flight

Wind resource modelers need accurate terrain heights to estimate onshore wind resources

Specifications

Delivery time: Some products are ready to go, others need a bit more processing time

To further enhance the accuracies of the DEM, a few ground control points (GCP) is very often beneficial

We will assist with experience and guidance

Price list

Typical pricing:

1m DEM: 60-90 EUR/sqkm

4m DEM: 30-50  EUR/sqkm

Minimum order size: 100 sqkm

EOatDHI part of the DHI GROUP

gras@dhigroup.com
+45 4516 9100

Agern Alle 5,
2970 Hørsholm,
Denmark

CVR: 36466871

Coastline Mapping

coastline mapping

Why is this important?

Coastal zone managers and port authorities have an advantage when they have access to information about the changes and trends in their coastal area.

Coastline mapping is a solution that uses satellite images and historical archives dating back to the 1960s with the option to combine with existing aerial photographs.

The highlights:

Archives dating back to the 1960’s and recent satellite data provides coastlines that are delivered in ready-to-use vector data format

The coastlines can be derived down to a map scale of 1:1.000, with spatial details of 0.5m to 30m, and comes with flexible options accommodating varying budgets and specifications

Digital maps of the entire coastal zone can be produced with embedded information such as vegetation, sediment, coastal protection, constructions etc.

In more detail..

DHI GRAS has profound experience in mapping coastal erosion and stability classification and with our expertise in this field we can tailor a solution that works for you.

Based on historical satellite data dating back to the 1960’s we can assess and quantify erosion/accretion changes over time. Methods used for extracting coastlines are typically semi-automatic object-based segmentation depending on the nature of the coast and the details needed in the final products.

Further classification of the coastal zone can be derived based on the timeseries of satellite data to extract information about dynamics and development of vegetation, coastal protection, constructions etc.

Tidal information can be considered by adding corrections based on DHI tidal models.

coastline mapping

EOatDHI part of the DHI GROUP

gras@dhigroup.com
+45 4516 9100

Agern Alle 5,
2970 Hørsholm,
Denmark

CVR: 36466871

Flood and drought monitoring and prediction

Flood monitoring

Why is this important?

Flood and drought monitoring provides access to the right data and information for governments and local authorities. This enables them to mitigate potential disasters.

Project highlights:

Reliable near-real-time remote sensing data and climate forecasts for flood and drought management on country and river basin scale

Automated data streams from a wide range of online sources for satellite-based rainfall, temperature, soil moisture, NDVI, water levels, chlorophyll, evapotranspiration, and more

Statistics and complex indices based on latest science that support in-depth analysis of severity of flooding and drought events

In more detail..

Increased floods in some areas and droughts in others, is having a substantial impact on the ecosystem and agriculture of the affected region and harming the local economy, often hitting developing countries the hardest.

The Flood and Drought project is working on a groundbreaking online system containing an array of data such as hydrographic, meteorological and demographic information in near-real time piloted by 10 water authorities across six countries and three transboundary river basins. This is a packaged solution providing not only data and information but also tools to integrate this information into the users planning.

The online portal allows for the users to locate and identify hazards, estimating impacts and providing risk assessment. It also includes a water indicator tool and water safety planning to support decision making as well as an application to understand crop yields.

To make the information accessible to stakeholders, we maintain data streams from more than 20 different online sources of remote sensing and climate data.

We compute statistics and complex indices based on latest science for enhanced assessment of flood or drought severity, available on country or river basin scale.

The software is developed as part of the Flood and Drought Management Tools project funded by the Global Environment Facility (GEF) together with the United Nations Environment Programme (UNEP) and the International Water Association (IWA).

Related items

AI4Water: Evapotranspiration

Satellite-based evapotranspiration for improved crop water efficiency in Uganda. Using Artificial Intelligence to assess evapotranspiration, saving up to 30% in irrigation consumption

Read More

SEN-ET

SEN-ET is the Estimation of evapotranspiration based on the Sentinel satellites. By providing insight in

Read More

EOatDHI part of the DHI GROUP

gras@dhigroup.com
+45 4516 9100

Agern Alle 5,
2970 Hørsholm,
Denmark

CVR: 36466871

Updated satellite-based maps of Greenland

satellite map greenland

Why is it important?

The new cartographic data will contribute to supporting Greenland’s infrastructure management as well as its economic development.

Precise and detailed maps are also important in connection with climate and environmental monitoring, rescue preparedness and business development.

Project highlights:

Procurement of satellite imagery and Digital Elevation Models covering 85.000 sqkm of Greenland

Facilitating topographic mapping of a large and remote area with high accuracy and without risks or need for mobilization

Independent advice and experienced support selecting the right satellite-based solution for the project purpose, based on close to 20 years of experience

The Danish Agency for Data Supply and Efficiency (SDFE) has produced a short video presenting their new 3D-panorama service, based on our data.

In more detail..

Since 2015, DHI GRAS has supported the Danish Agency for Data Supply and Efficiency (SDFE), in close cooperation with Greenland’s Government, in their mission to provide updated topographic maps of the ice-free areas of Greenland. The current topographic maps of Greenland are outdated and due to the large size of the country, it is not the easiest to map.

Together with our close partners at Airbus Defence and Space we have provided ready-to-use orthomosaics and detailed Digital Elevation Models (DEM) for an area covering 85.000 sqkm of Greenland.

The satellite data products were produced based on dedicated image acquisitions of up-to-date stereo satellite imagery from the SPOT 6 and 7 satellites.

Danish Agency for Data Supply and Efficiency:

The Danish Agency for Data Supply and Effeciency (SDFE) provides high-quality data to the public and private sectors, enabling them to make important community decisions on the best possible basis.

They are a workplace that spans widely and is part of the Danish Ministry of Climate, Energy and Utilities.

Related items

EOatDHI part of the DHI GROUP

gras@dhigroup.com
+45 4516 9100

Agern Alle 5,
2970 Hørsholm,
Denmark

CVR: 36466871

Consultancy for the European Environmental Agency

GIS consultancy satellite

How we helped:

DHI GRAS provides expert assistance to assist the implementation of various activities pertaining to the Copernicus Land Monitoring Service (CLMS) managed by the EEA, including; technical support to produce Pan-European high-resolution mosaics; methodological and analytical support to review the readiness and uptake potential of the Data and Information Access Services (DIAS); management support to assist the EEA in managing the production contracts pertaining to the 2018 reference year update of the High Resolution Layers (HRL’s); onsite support to provide the technical staff at EEA with dedicated software routines easing their work with quality assurance of Copernicus Land products by on-site and customized training in GIS and Remote Sensing software.

Project highlights:

Providing on site consultancy support within processing and analysis of satellite images and other geospatial data

Development of dedicated and automated software procedures for handling and dissemination of large volume of image data

Production of high-resolution image mosaics and quality assurance of Pan-European Copernicus products such as hydrological layers, land cover maps and Digital Elevation Models

In more detail..

The framework agreement with the European Environmental Agency (EEA) covers consultancy services within Geospatial Information Systems (GIS) and advanced image processing of satellite imagery.

We were contracted to support the EEA with advanced image analysis and automation of tasks related to the handling of Copernicus land products, including production of pan-European high resolution Mosaics and methodological support for deriving deep learning approaches to extract small landscape features from very high resolution satellite images.

For this we provided on-site support for advanced image analysis including handling of large volume raster datasets, geometric corrections, image classifications, supervised and non-supervised classifications, data integration, publishing of web-services, mosaicking, image catalogue maintenance and so on.

We also provide analytical support to assess DIAS readiness for CLMS data integration and management support to facilitate the seamless production of the 2018 reference year high resolution layers.

High resolution mosaic covering the EEA39

European Environmental Agency:

The EEA is an agency of the European Union (EU), tasked with the provision of sound, independent and reliable environmental information.

The EEA undertakes important work related to the European Copernicus programme – previously known as Global Monitoring for Environment and Security (GMES).

The GMES/Copernicus (2011-2013) Initial Operations of the land monitoring service (or ‘GIO’ land) prioritise multi-purpose information common to a large user community.

EOatDHI part of the DHI GROUP

gras@dhigroup.com
+45 4516 9100

Agern Alle 5,
2970 Hørsholm,
Denmark

CVR: 36466871

Earth Observation for the Sustainable Development Goals

Earth observation sustainable development goals

Why is it important?

In 2017, the global indicator framework (232 indicators) for the Sustainable Development Goals and targets of the 2030 Agenda for Sustainable Development was adopted by the United Nations, with the aim of monitoring progress, inform policies and ensure accountability.

However, data collection and information management processes are burdensome and many countries are challenged by fulfilling the required monitoring and reporting for the SDG framework.

The potential of Earth Observation techniques to address some of these issues are clear, but undersold, and the EO for SDG-project aims to maximize the contribution of EO data to the SDG agenda by producing targeted high-quality indicator monitoring guidelines and effective outreach material, and by showcasing the usability of EO data in country demonstrations studies in dialogue with UN stakeholders.

Project highlights:

Exploiting technology improvements of Earth Observation data and services to underpin the monitoring and reporting framework of the SDG’s

Supporting national stakeholders in applying EO based techniques to support, and extend, existing monitoring and reporting capabilities and promote the benefits of integrating EO in the SDG monitoring framework

Increasing uptake and awareness of EO services in support of the SDG’s to inform decision-makers about the added value and benefits of EO-based monitoring and reporting minimum impact

In more detail..

The Earth Observation for the DHI (Denmark), GeoVille (Austria) and the UN Environment World Conservation Monitoring Centre (UNEP-WCMC, UK). The project commenced in the 1st quarter of 2018 and is expected to run for 18 months.

To increase the contribution and impact of EO data on the SDG agenda the project will deliver a range of outputs, including:

European Space Agency:

The European Space Agency (ESA) is the European space programme and its mission is to explore Earth, its immediate space environment, our Solar System and the Universe.

ESA also works closely with space organisations outside Europe to develop satellite-based technologies and services, and to promote European industries.

EOatDHI part of the DHI GROUP

gras@dhigroup.com
+45 4516 9100

Agern Alle 5,
2970 Hørsholm,
Denmark

CVR: 36466871

SeaStatus – Sea and coast monitoring

Sea and coast monitoring

Why is it important?

Seas and coasts are considered key drivers of the economy (Blue Growth) by EU and OECD. Through sustainable exploitation of the marine ecosystem, we ensure a continued contribution to human welfare, instead of overexploitation leading to severe consequences for the natural capital.

The key to a sustainable human exploitation of marine resources is precise knowledge of existing conditions and accurate predictions of anthropogenic pressures. Sea and coast monitoring provides valuable insights for all actors involved.

Project highlights:

Developing novel algorithms to derive water quality information and map marine habitats from Copernicus data in high spatial and temporal resolution

Novel and traditional measurement techniques and data processing algorithms are combined with models allowing for a continuous update of the environmental status and improvement of management practices

SeaStatus will develop a range of decision support tools for intelligent marine ecosystem management allowing for optimal use of marine resources at minimum impact

Sea and coast monitoring

In more detail..

SeaStatus combines innovative monitoring with new models for decision-making to support sustainable exploitation of the marine environment by improving the knowledge base and predictability of management scenarios.

SeaStatus addresses the entire value chain from data acquisition, quality assurance, data integration and assimilation (DA) and embeds the developed methods into robust ICT tools (data processing & integration, modelling) readily available for consultants and authorities for new EIA services and efficient and sustainable ecosystem management tools, products and services, which are unavailable today.

The project is funded with 10 mio. DKK from the Danish Innovation Fond (IFD) and runs from 2017 - 2020.

DHI GRAS is contributing to this by:

Innovation Fund Denmark:

The overall aim of Innovation Fund Denmark is to support the development of knowledge and technology, including advanced technology, in order to strengthen research and innovative solutions that may benefit growth and employment in Denmark.inno

EOatDHI part of the DHI GROUP

gras@dhigroup.com
+45 4516 9100

Agern Alle 5,
2970 Hørsholm,
Denmark

CVR: 36466871

Mapping submerged coastal vegetation

submerged coastal vegetation

Why is it important?

Marine habitats are important regions for life in the coastal zone. It is one of the key indicators of ecological status and environmental state of water bodies and therefore widely used in reporting related to e.g. the EU Water Framework Directive and the Birds Directive and as input in Environmental Impact Assessments (EIA’s).

With this project a first-ever complete baseline of the spatial distribution will be created which will allow for a future assessment of any changes in submerged coastal vegetation.

Project highlights:

Using satellite data, machine learning and radiative transfer modelling to accurately extract detailed information about marine habitats

Integration of various data sources (in-situ, satellite and models) to provide a more complete and holistic description of the coastal zone

Project outputs will be made openly and freely available providing a baseline for future assessments of changes in the ecological status on national to local scale

In more detail..

DHI GRAS has been awarded a grant from the VELUX FOUNDATION to conduct a first-ever nationwide mapping of the submerged coastal vegetation (eelgrass and macroalgae) in Denmark. Based on advanced radiative transfer modelling and machine learning techniques, optical satellite data is used to create a 10 m national map of these important coastal habitats. The project runs from 2018 to 2019.

The results will be made publicly available to stakeholders active in the coastal zone, including authorities, coastal planners, engineering companies and environmental consultants.

The free and open access approach is part of an active wish from the VELUX FOUNDATION and "DHI GRAS to expand our knowledge of the coastal zone processes and environmental state.

These are the core elements of the project:

In 2018, VELUX FONDEN granted approx. EUR 35 million. ​VELUX FONDEN (a part of THE VELUX FOUNDATIONS) is a philanthropic foundation that supports scientific, cultural, social and environmental purposes.

Furthermore, the foundation supports projects relating to active senior citizens and research in gerontology and ophthalmology. All grant areas share the purpose of promoting the democratic society of Denmark on an informed, inclusive and sustainable basis.

EOatDHI part of the DHI GROUP

gras@dhigroup.com
+45 4516 9100

Agern Alle 5,
2970 Hørsholm,
Denmark

CVR: 36466871

Monitoring agricultural fields with satellite images

Satellite data analysis remote sensing earth observation Monitoring agricultural fields

How we helped:

Machine Learning and Data Fusion for crop-type monitoring. By building a likelihood model based on timing of the main crop harvest, the timing of parcel tillage after the main harvest and the field greenness in the September period to monitor the presence of catch crops.

Project highlights:

Building a national operating system for deriving agricultural parameters based on time series of both SAR and optical satellite data

Development of a user friendly web viewer for visualizing data and results allowing the user to search for specific field parcels and associated attribute information

Analysing time series based on advanced Machine Learning methods and data fusion for crop monitoring and likelihood model for monitoring of harvest and catch crops

In more detail..

The Danish Agricultural Agency is today performing control visits to field parcels across the entire country, to check if farmers report correctly on their crop types and farm management practices related to the CAP.

This line of work constitutes a significant work load and involves many field visits. The Danish Agricultural Agency needed a solution to check if farmers were reporting correctly in accordance with CAP requirements while at the same time reducing the amount of time spent on control visits.

All satellite data and results were presented on a web viewer developed to meet the client’s needs for assessing the satellite-derived information to be used in their CAP monitoring.

In short, we provided the Danish Agricultural Agency with:

Danish Agricultural Agency:

The staff of the Danish Agricultural Agency, a total of approximately 1,200, strives countrywide to create the optimal conditions for sustainable growth and green transformation in the fields of Agriculture and Plants and horticulture.

They administer and provide grants for agricultural production, environmental and ecosystem improvements, development programmes, grants for minor projects, and administer subsidies for certain types of export.

EOatDHI part of the DHI GROUP

gras@dhigroup.com
+45 4516 9100

Agern Alle 5,
2970 Hørsholm,
Denmark

CVR: 36466871