Supporting the Copernicus Land Team at the European Environmental Agency:
28 June 2019
In continuation of our excellent collaboration on previous activities with the European Environment Agency (EEA), DHI GRAS is providing on-site consultancy services for the Copernicus Land Team at the centrally-located offices of the EEA in the heart of Copenhagen.
We are supporting the Copernicus Land Team with on-going Pan-European mapping activities and advising on technical specifications including recommendations on geospatial data and systems integration, such as the integration of Copernicus Land Monitoring Service (CLMS) data in DIAS (Data and Information Access Services) platforms.
We are also producing seamless high resolution image mosaics of 39 European countries (EEA39), which are both geometrically and radiometrically corrected.
Copernicus is the European Union's Earth Observation Programme, looking at our planet to provide users in the field of environment and other terrestrial applications with information based on space data in six thematic areas: land, marine, atmosphere, climate change, emergency management and security.
For more information about our previous activities with the EEA and Copernicus Land Monitoring Service
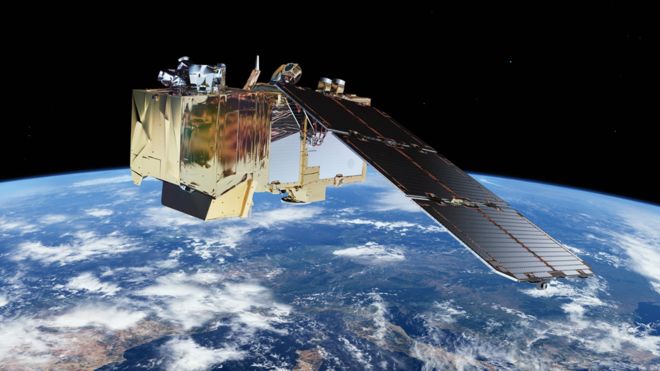
A new system is being considered for inclusion in the EU’s Earth Observation programme, Copernicus, to estimate water-use by plants evapotranspiration and to improve crop water-use productivity.
The Land Surface Temperature Monitoring (LSTM) mission will be able to identify the temperatures of individual fields and would be more than 400 times as detailed as what is delivered by the current Sentinel satellite land surface temperature sensors.
The increased resolution and precision of LSTM will enable specialists to calculate in real time how much water different plants require in different areas, and how often those plants need to be irrigated. It could also be used to help predict drought conditions.
The LSTM mission will complement the existing family of Copernicus satellites, sentinels, for observing the land and coastal areas, and will hopefully become an operational spacecraft within the next decade.
Our senior remote sensing specialist, Radoslaw Guzinski, is one of the authors behind the Mission Requirements Document, and we will follow the activities closely in the coming years.
In the meantime, we are working on innovative methods and tools to estimate field-scale plant water-use with the data coming from existing Copernicus satellites.
See link below for project website.
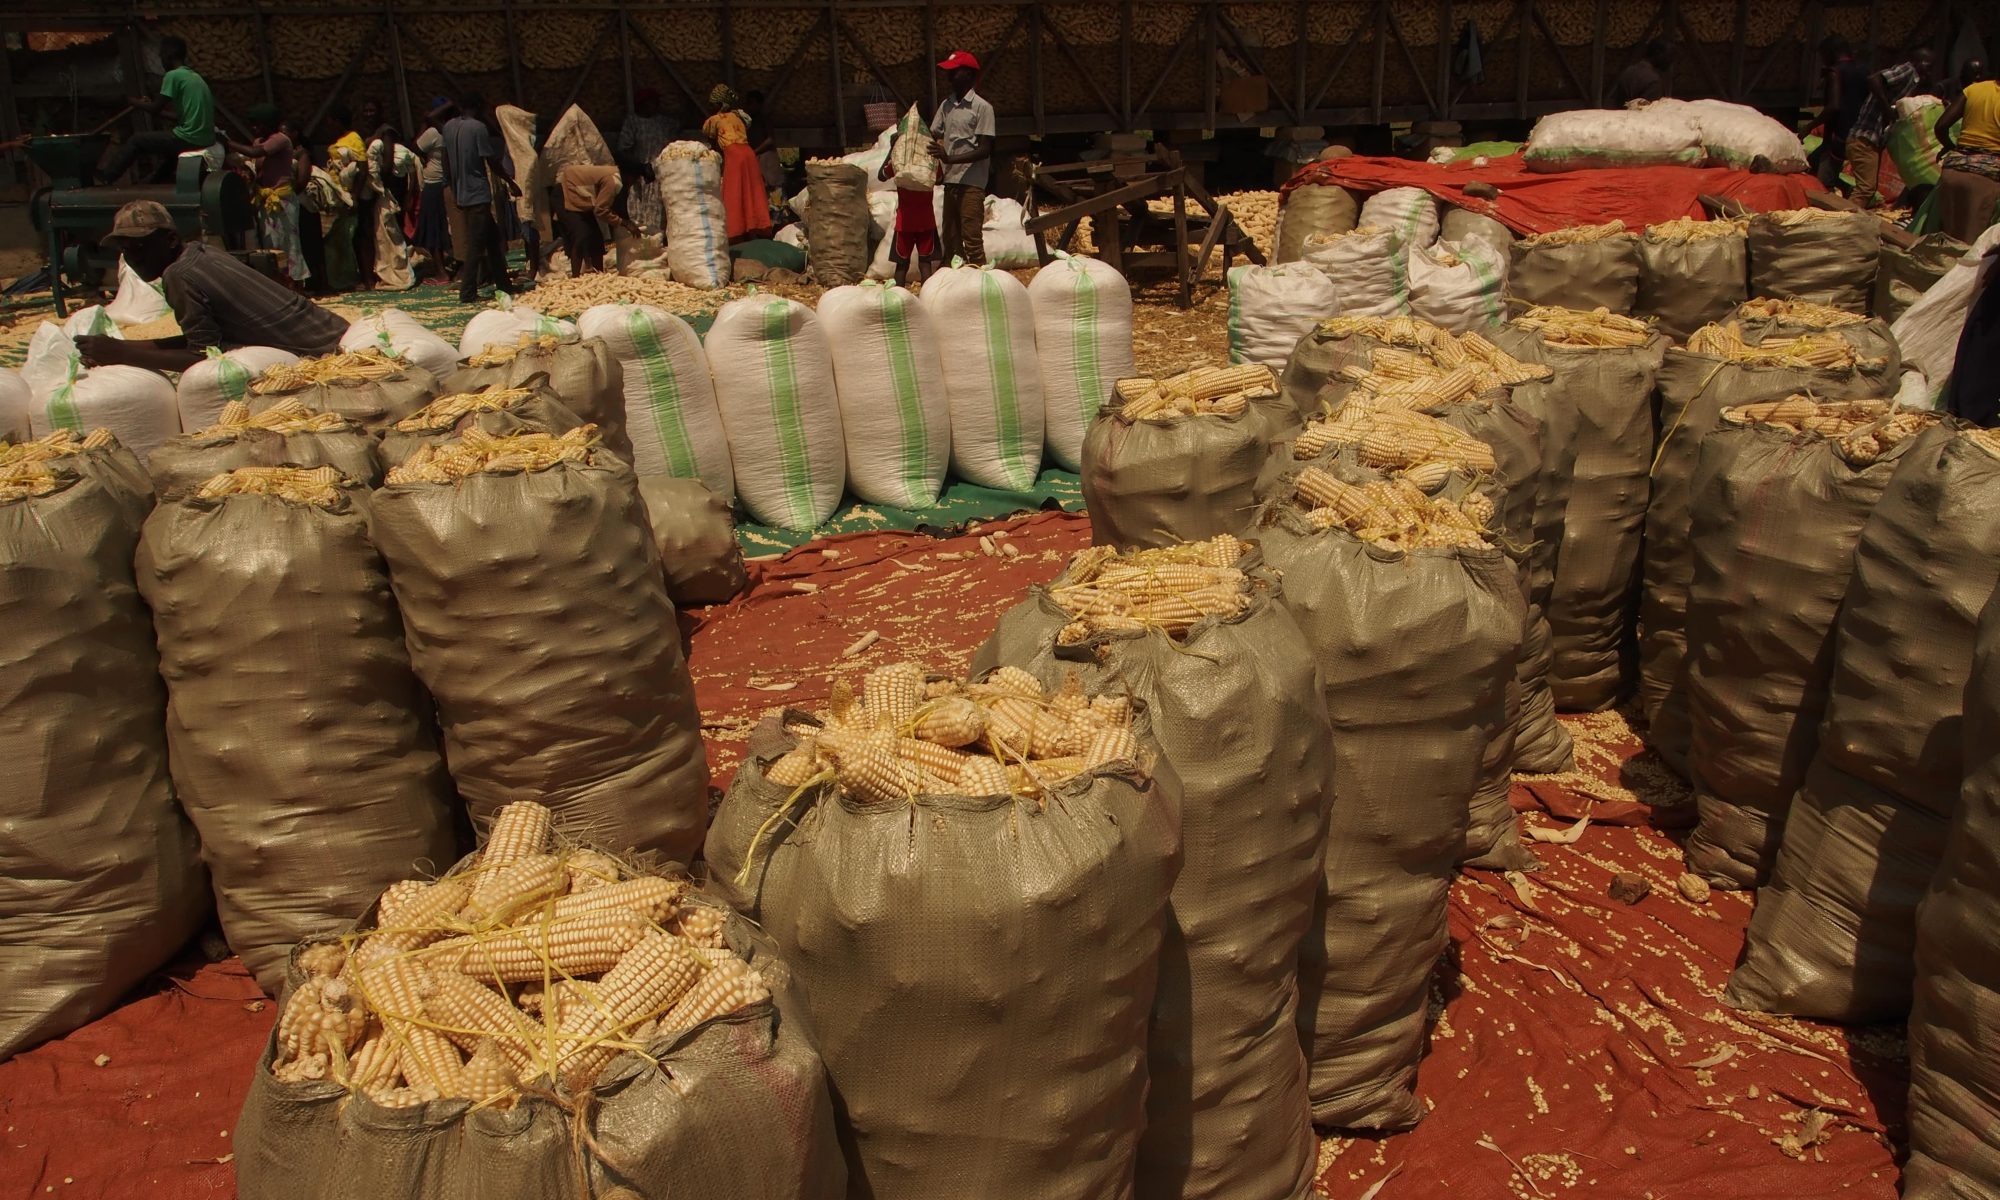
As part of our AI4Earth grant funded by Microsoft and National Geographic Society, Torsten Bondo is in Washington DC for the annual National Geographic Explorer Festival.
It is an extremely exciting and inspiring venue featuring marine biologists, glaciologists, mountaineers, photographers and many other people with an interest in natural sciences.
Torsten Bondo is there to discuss our Uganda project using AI and satellites to assist agricultural irrigation schemes and safeguard the scarce water resources. A method that has the potential to work on a global scale.
Berlingske Media has published an article about the project [in Danish].
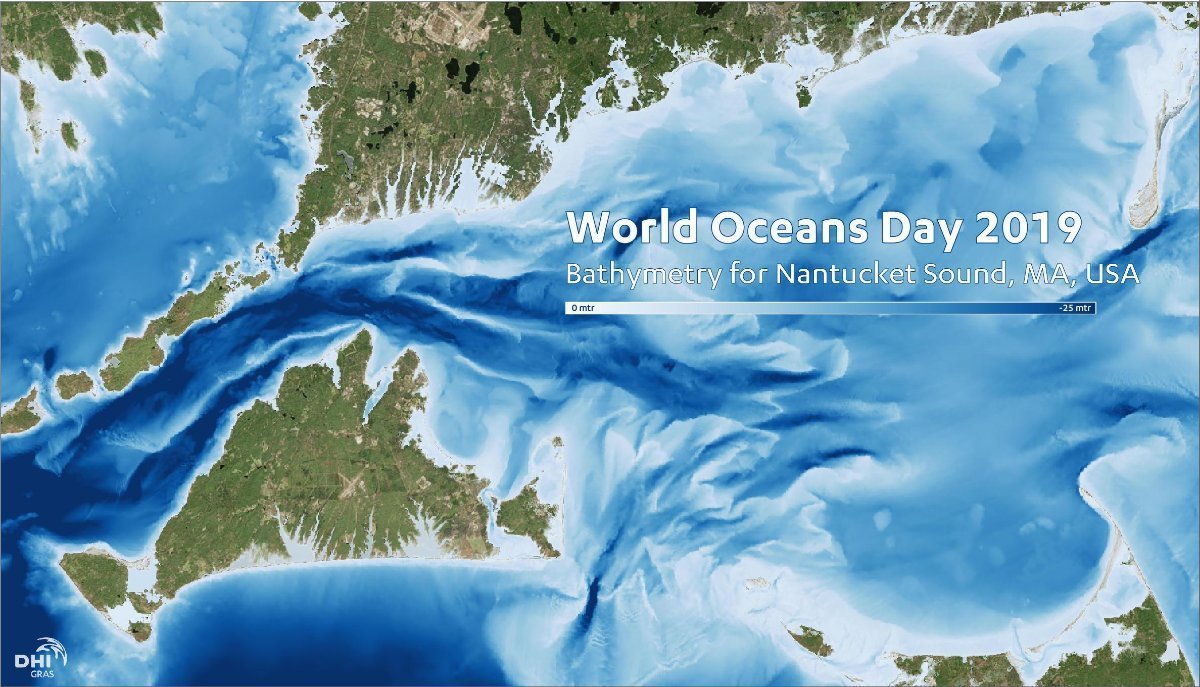
Bathymetry is a key element in Hydrodynamic Modelling and Marine Spatial Planning activities.
Accurate and detailed bathymetry data is therefore an important factor for a successful implementation of a sustainable Blue Economy.
We celebrate World Oceans Day with an example of a bathymetry map from an area with intense focus on Offshore Wind Energy.
Here the Satellite-Derived Bathymetry has been merged with other existing data sets to create a seamless, fully updated and detailed bathymetry layer.
In recent years, advances in the satellite technology and physical modelling has allowed for vast improvements in the accuracy and availability of Satellite-Derived Bathymetry data.
It is also much more cost-efficient than traditional survey methods and mitigates the environmental impact of onsite surveys.
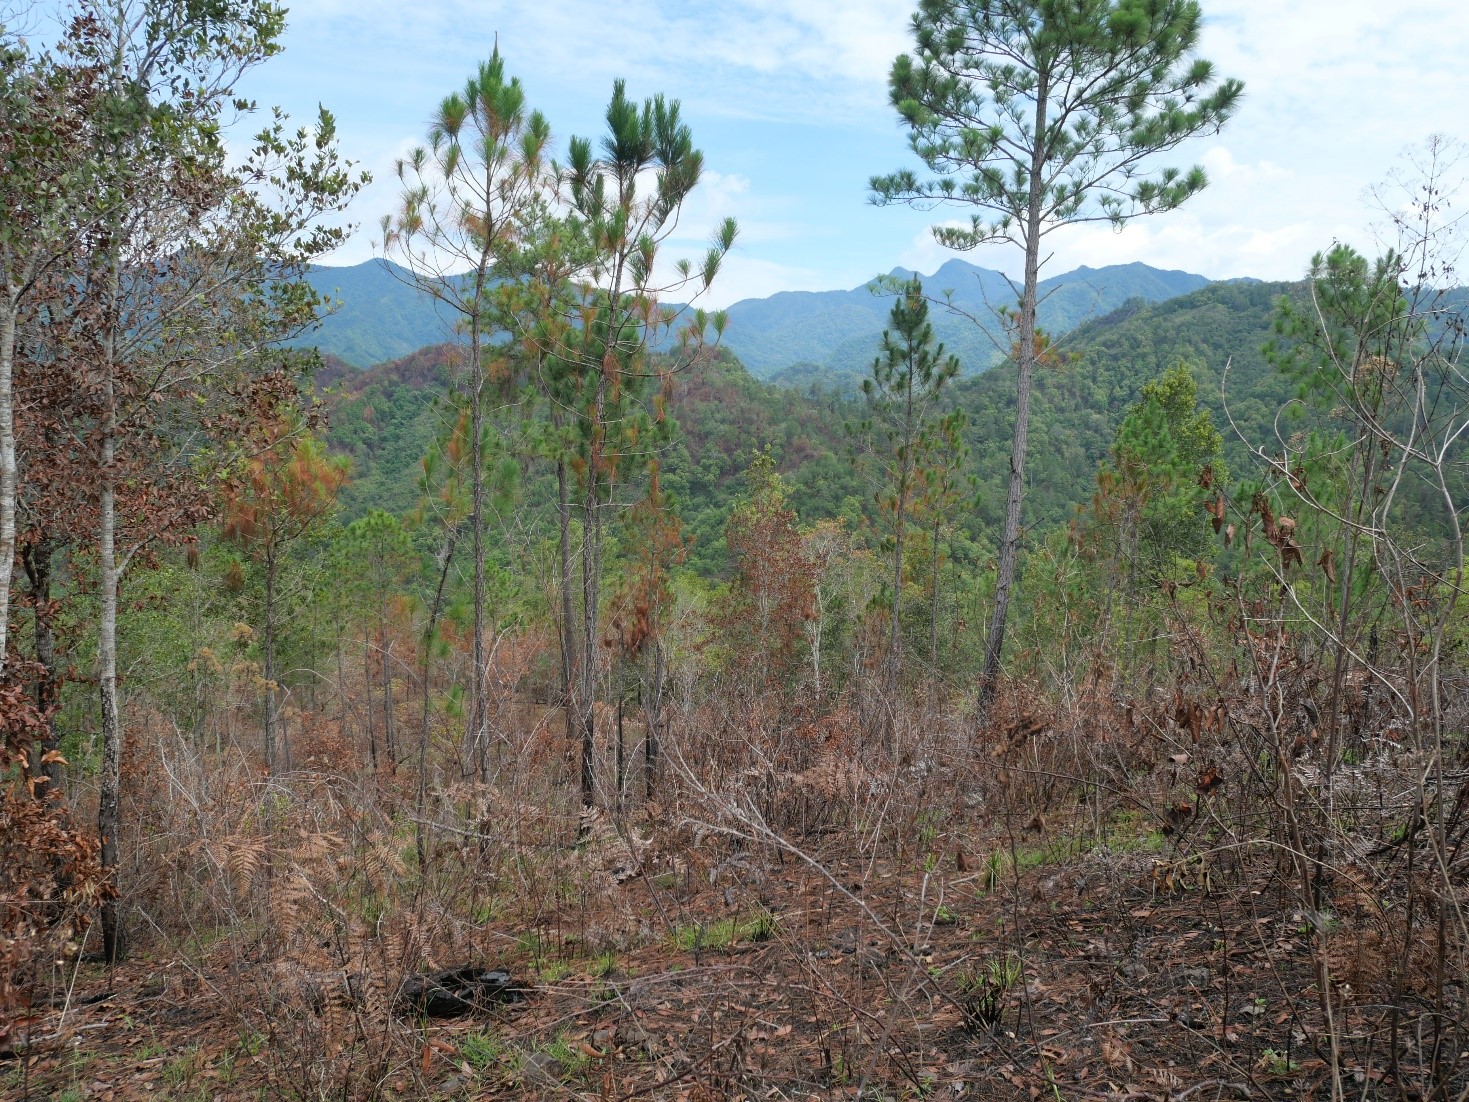
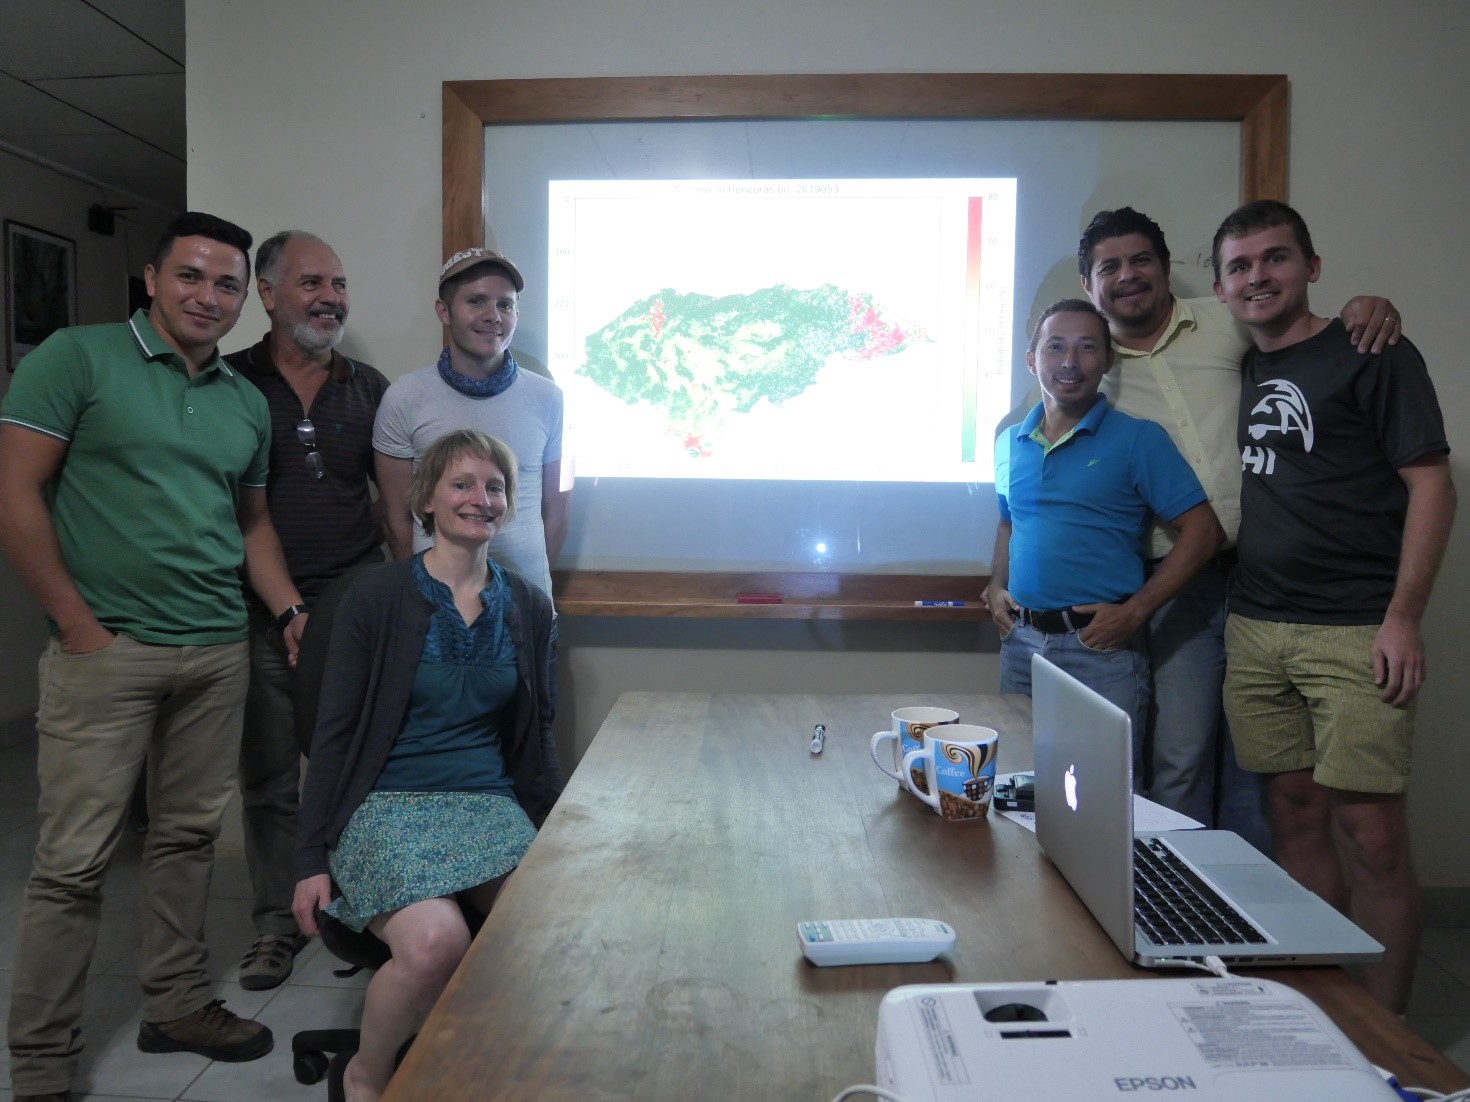
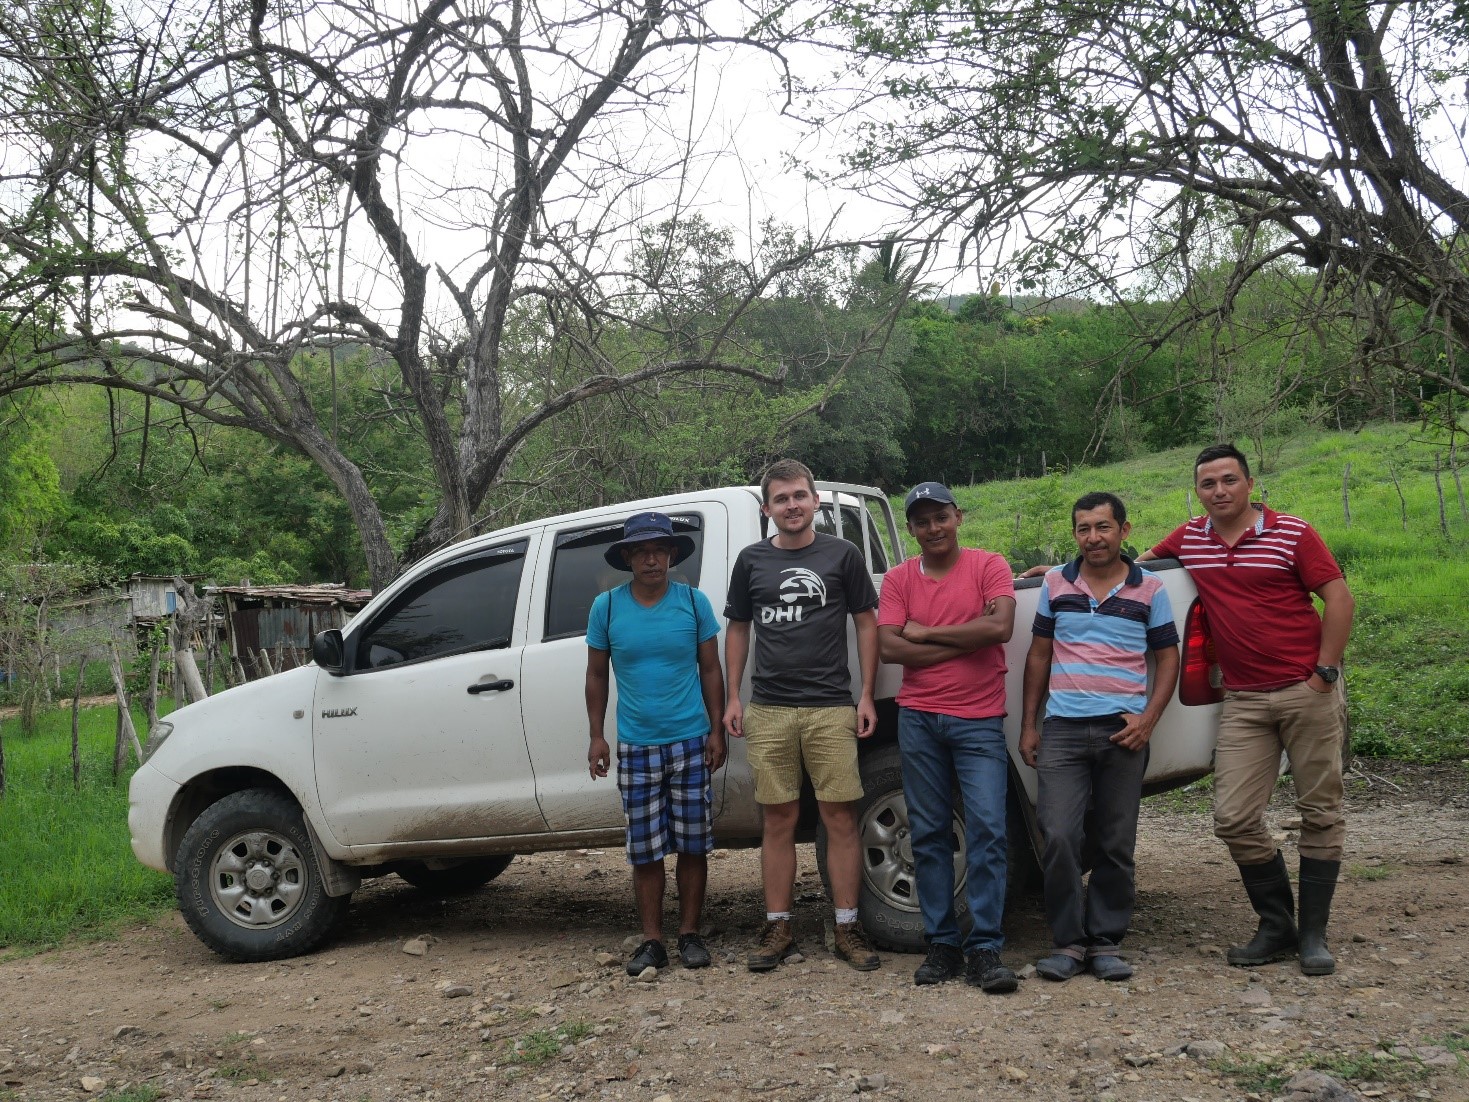
The past two weeks Silvia Huber and Daniel Druce have been in Honduras, where they have held a hands-on training session on using specialized remote sensing tools for forest monitoring with our partner, Forests of the World (Verdens Skove) and assessed the results in the field.
The aim of the training was to teach local key individuals from Forests of the World how to use Google Earth Engine and other tools for monitoring pine forests affected by the destructive pine bark beetle, including the methodology of a fire risk analysis.
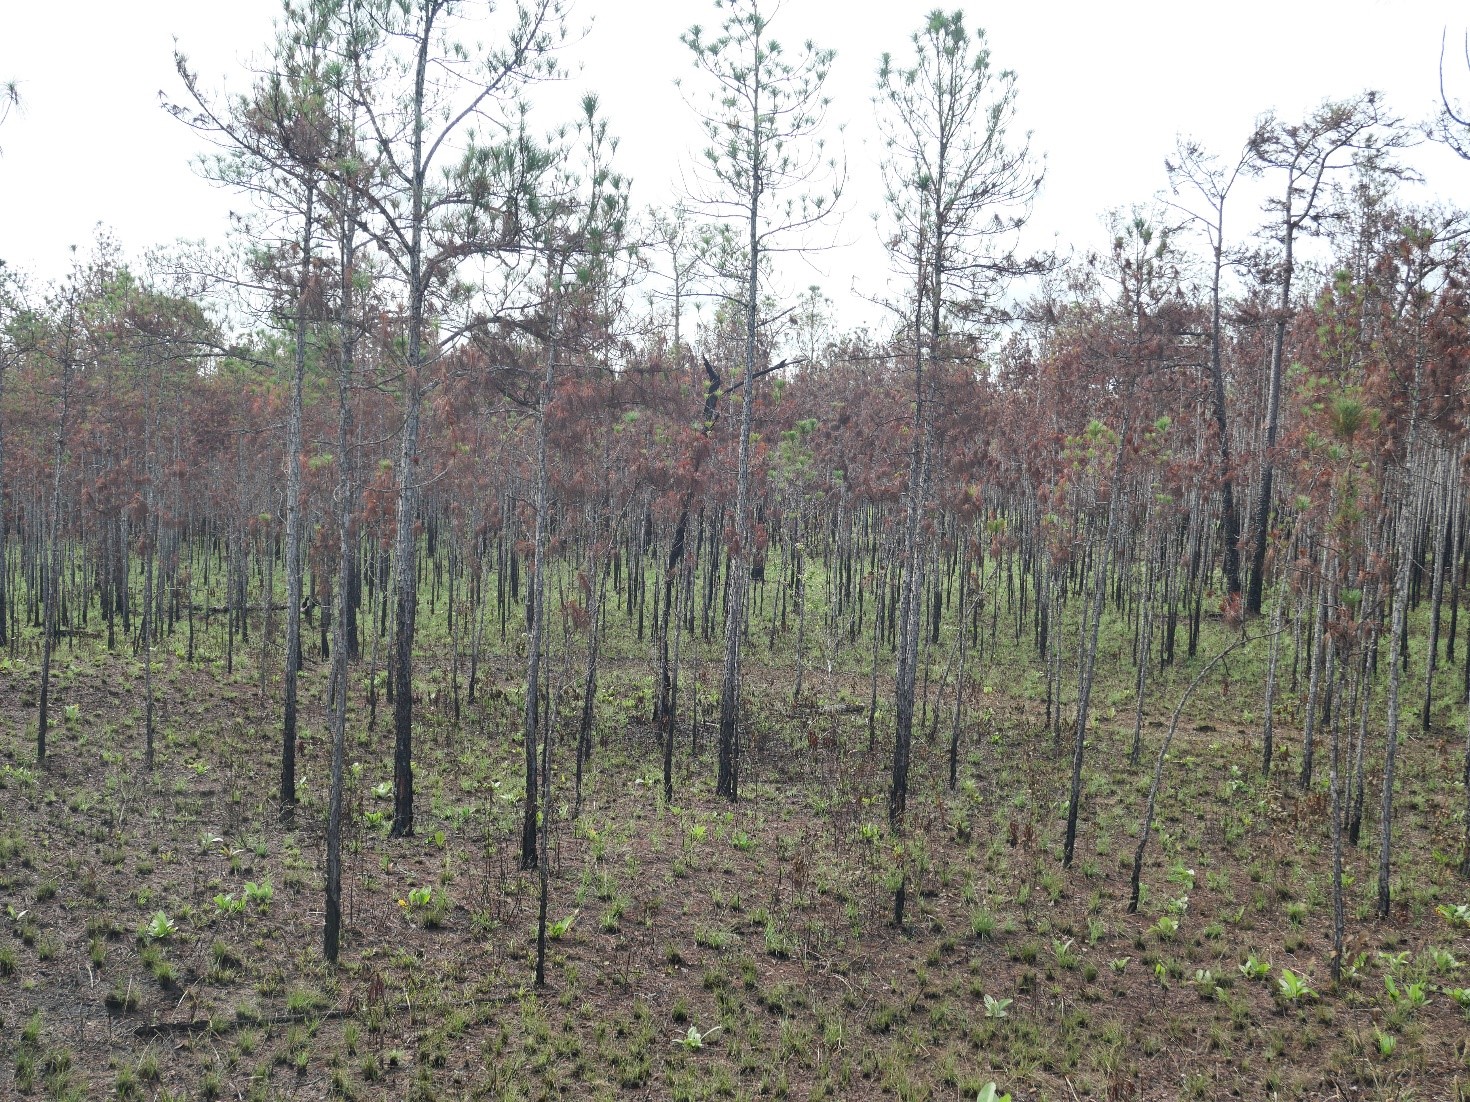
We also evaluated the effectiveness of the results, we have created for pine bark beetle monitoring. Few areas are currently under attack from pine bark beetles, which limits the validation results, but attacks are expected in the near future, which is why it is important to develop monitoring systems now so they are in place when the attacks happen again.
Burnt areas were easily detected, which is good news as both threats cause the pine trees to turn red. Therefore, it is likely, that it will also prove a good indicator of pine bark beetle attacks but further validation is necessary.
Our training was well received, and we look forward to continuing our activities in Honduras with Forests of the World.
Forest of the World has written a blog post about our joint ventures in Honduras [in Danish], follow the link.
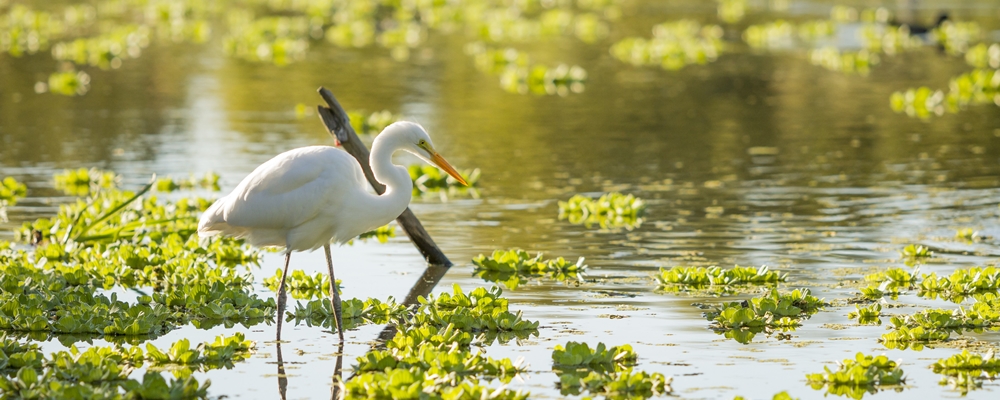
Today is World Environment Day, and we want to highlight the importance of wetlands.
Wetlands are vital ecosystems for countless of species and are among the world’s most productive environments. The properties of wetlands serve as Ecosystem services ranging from freshwater supply to climate change mitigation.
Wetlands are sensitive to atmospheric disturbances, and the ecosystem services that many livelihoods depend on are threatened.
90% of all UN member states have ratified the Ramsar Convention, which provides the framework for the conservation and wise-use of wetlands and their resources.
We are part of a project led by the Ramsar Center for Eastern Africa (RAMCEA), setting out to explore the potential of Earth Observation satellite data for taking stock of and monitoring wetlands.
The project has demonstrated how Earth Observation can support wetland monitoring in Uganda and with continued training sessions can become a valuable tool for wetland managers and practitioners, not only in Uganda, but potentially also paving the way for other East African countries to achieve a complete wetland inventory in the future.
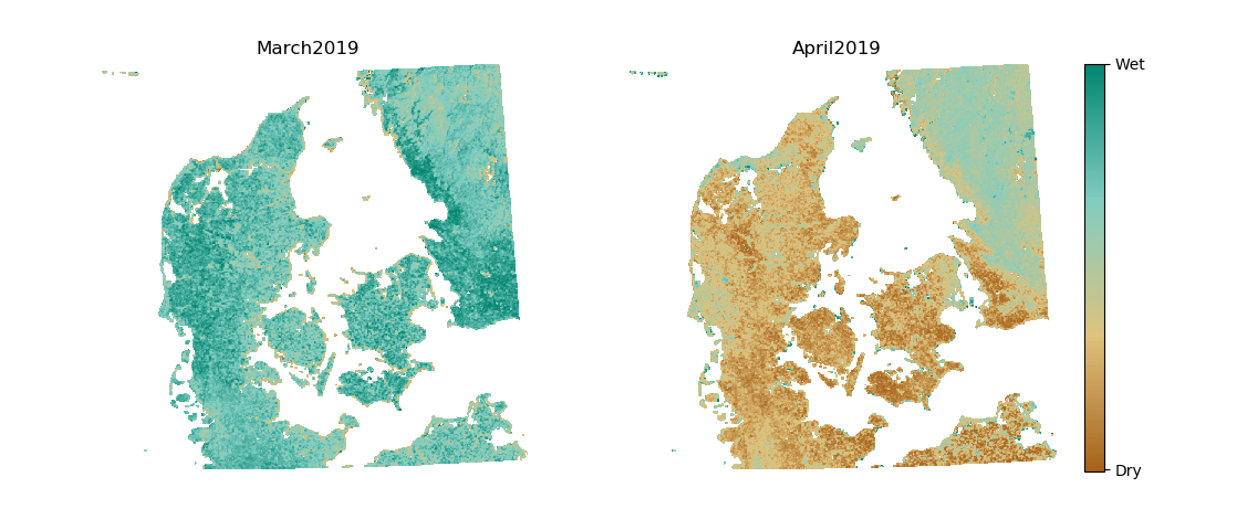
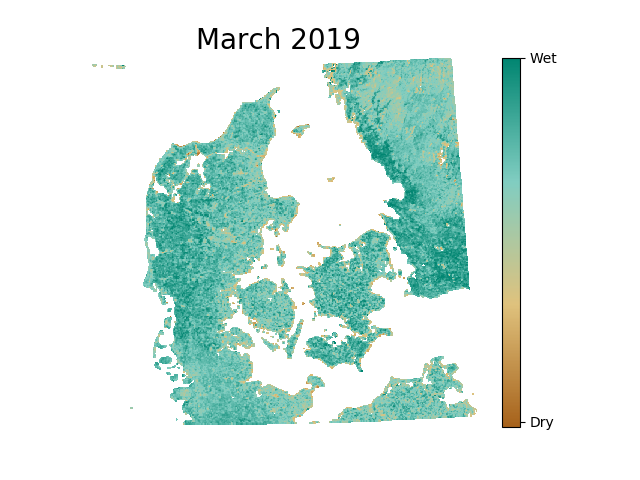
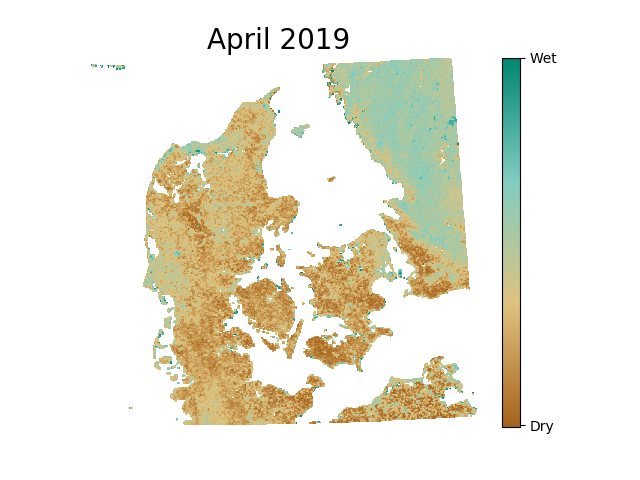
A new rainfall record in March was followed by a very dry April with record sunshine hours.
Recent weather patterns in Denmark is giving us an opportunity to show you how satellites can be used to extract soil #moisture from the Sentinel-1 radar satellites.
Using cloud-penetrating Sentinel-1 observations we were able to get almost daily soil moisture measurements in both months, despite March having only 119 sunshine hours compared to 274 hours in April.
The images show the monthly average surface soil moisture for March and April this year and clearly illustrates the unusually wet and dry conditions compared to previous years.
DID YOU KNOW?
Soil moisture is a key variable to understand many environmental processes such as vegetation health, #drought and #flood risks and plays a large role in climate models.
Changes in soil moisture of the top few centimeters of soil, greatly influences the characteristics of the soil, which makes it possible to measure with radar instruments mounted on satellites.
DHI GRAS is working together with DHI on assimilating satellite based soil moisture observations into complex hydrological models.
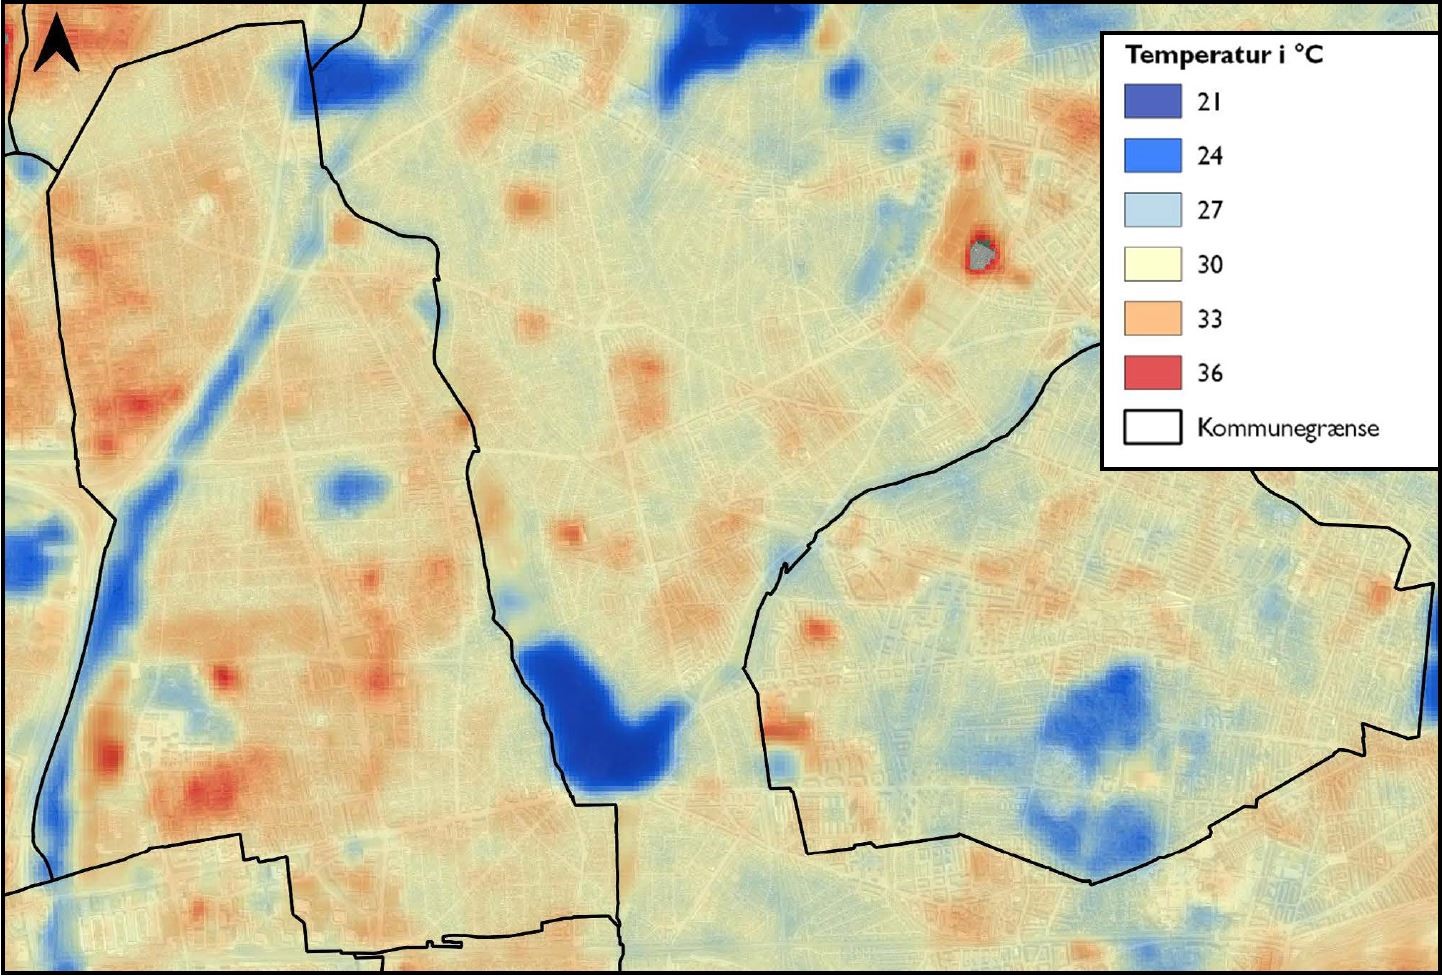
Urban Heat Islands mapped for Rødovre municipality:
20 May 2019
Our Urban Heat Island data can be found in the Sustainability Report 2019 from Rødovre municipality. The yearly report is part of the municipality’s Agenda 21 strategy, where they use sustainability as the basis for the development of Rødovre.
We provided a land surface temperature map, that illustrates the large variance in temperatures across the municipality depending on the urban land use. The map shows a 15 degree difference between some areas, which is dependent on the presence of vegetation and water bodies, due to their “cool down”-effect in contrast to the heating effect from the built-up areas.
We have previously done similar work for the municipality of Copenhagen, where we found a 12 degree difference between areas in the city throughout a very warm and dry summer.
UHIs are a concern in many cities, and known to have significant impacts on the lives of the residents in urban areas as well as the urban environment.
Interested in using satellite data to map Urban Heat Islands for your municipality? Contact us at gras@dhigroup.com
The extra information has provided a huge leap forward in computer vision capabilities and is used to more accurately identify specific objects and land cover classes of interest.
The application of Deep Learning (DL) to analyse satellite imagery is paving the way for the Earth Observation field to reinvent itself.
This can extend the reach through novel idea-thinking to solve new challenges and optimise traditional ways of monitoring and mapping.
Thanks to the exponential growth of active satellites together with advancements in Big Data and Cloud Computing, information from space is becoming more accessible.
This allows for enormous quantities of data to be stored and analysed at a much faster pace.
At DHI GRAS mapping of specific features of interest and land cover is a key service delivery. We are experts in extracting information from satellite imagery to meet our client’s needs.
A common approach has been to train classical machine learning algorithms (e.g. Support Vector Machine or Random Forest) to label each pixel in a satellite image.
However, one of the shortcomings of this approach is that each pixel in the image is classified independently of its neighbouring pixels – meaning the spatial context in imagery is not considered.
The main advantage of Deep Learning algorithms is that they can recognize patterns, shape, and context in imagery, and use this to better map different objects of interest.
By doing so, they use not only the spectral information from pixels, but also the surrounding spatial information that is associated with objects.
Land Cover Mapping
Our Deep Learning Lab has seen significant improvements in land cover mapping using latest DL algorithms for image segmentation.
For large area mapping we take advantage of imagery provided by the European Space Agency’s Sentinel satellites. These satellites deliver state-of-the art optical and radar imagery free of charge for the entire globe – which have revolutionized mapping capabilities since they were launched in 2015.
Using this imagery in combination with Deep Learning has greatly improved our capabilities in mapping specific land cover or land use types including water & wetlands, crop-types, irrigated areas, forests and many more.
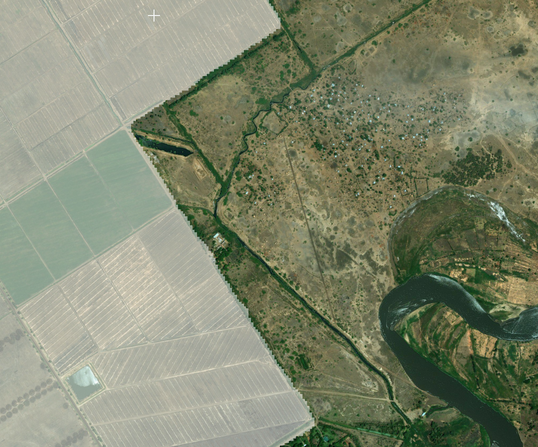
Mapping of irrigated cropland in Malawi using Convolutional Neural Networks (CNN) and Semantic Segmentation.
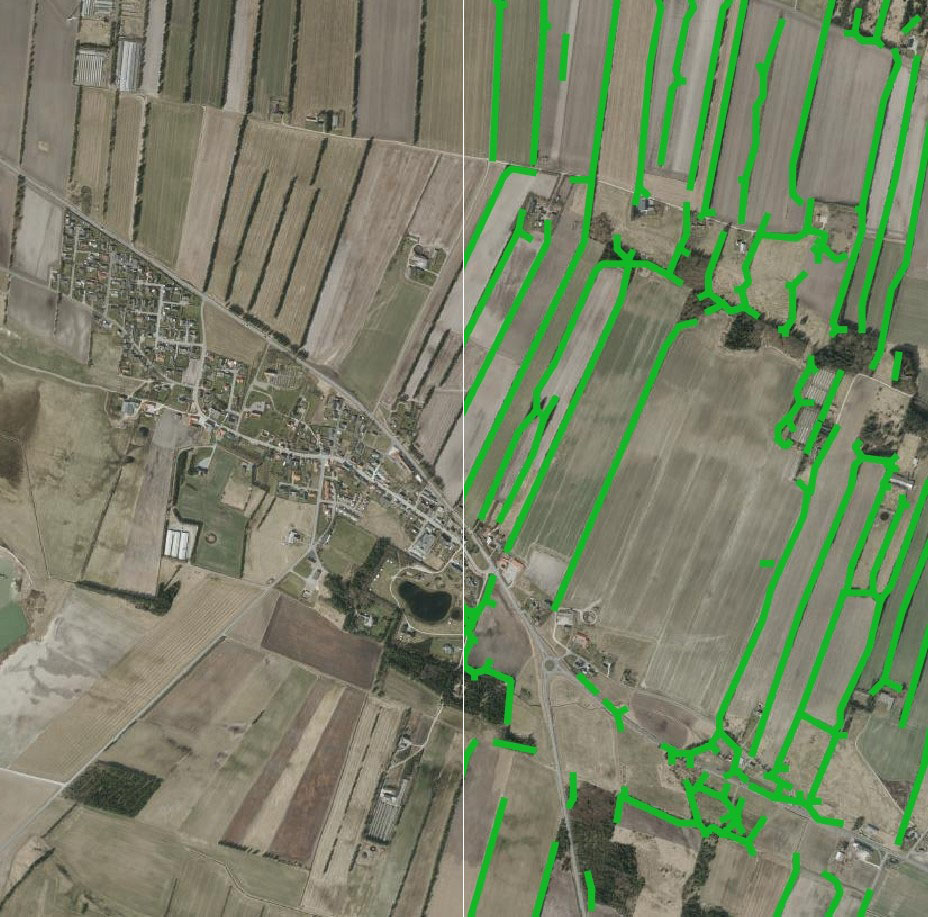
Mapping ‘wind breaks’ in open landscapes using Deep Neural Networks. Satellite imagery (left), predicted windbreaks (green outline) from the Deep Neural Network (right).
Mapping wind breaks in open landscapes
One of the latest innovations we have been working on is mapping ‘wind breaks’ in open landscapes, relevant for the wind power industry. Wind breaks are barriers such as tall fences, walls and hedges located throughout the landscape which can increase the surface roughness and drag, and decrease the expected wind flow. Information on the location of windbreaks is therefore important when making wind flow models and planning the location of wind turbines.
Interestingly, this DL network was originally designed for biomedical image segmentation, however it has proved highly useful when applied to satellite imagery. We trained and validated the model on Sentinel-2 imagery using a sample of known wind breaks throughout Denmark, with impressive results. Once identified, these wind breaks can then be used for better estimation of surface roughness.
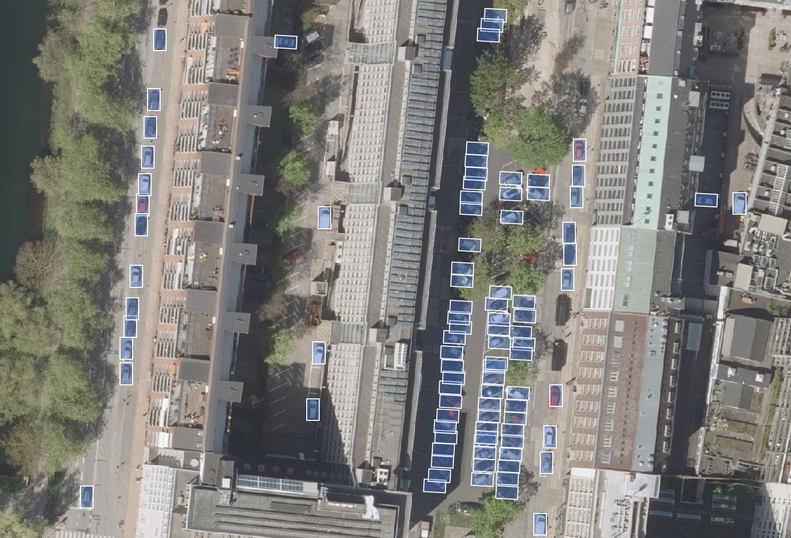
Object Detection
We have also had much success with using DL for object detection and recognition in satellite and aerial images. We have found that many of the DL models used in other fields such as biomedical imaging and self-driving cars, work equally well on satellite images, with little adaptation.
Furthermore, we have been able to use transfer learning, to leverage models pre-trained on more general image datasets, . This is great news, since it enables us to get good results with comparatively little training data.
In short, this means that we can detect objects such as cars, solar panels, swimming pools, etc. with high accuracy and short turnaround for delivery, while only requiring a small amount of training data even for larger areas.
Locating solar panels on rooftops using Deep Learning.
Tracking cars in urban areas with Region-based Convolutional Neural Network (R-CNNs).
Powerful new advancements
Modern Earth Observation holds great potential to bridge the gap between Remote Sensing and AI, and allows for users to gain insights like never before.
At DHI GRAS, we are intrigued by the developments we are seeing in this field.
We are working hard in our Deep Learning Lab to explore what is possible and inspire our clients to think in new ways. Our aim is to create awareness of how DL has the potential to significantly optimize existing workflows.
We welcome all ideas – so if you have an object you would like us to map, we can be reached at gras@dhigroup.com.
Authors: Philip Graae (phgr@dhigroup.com) & Kenneth Grogran (kegr@dhigroup.com)
Working with satellite imagery would be much easier if there were no clouds obstructing the view from satellites that orbit the earth far above the clouds.
Luckily, there are several clever ways to solve this problem. One way is to stitch satellite images of the same area together to create a composite.
Composites can be computed for any period of time, e.g. monthly, yearly, and for any area around the world.
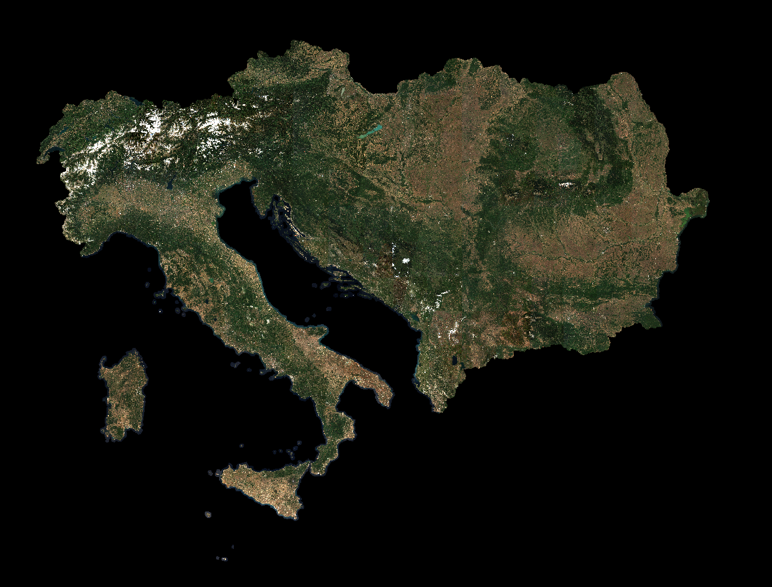
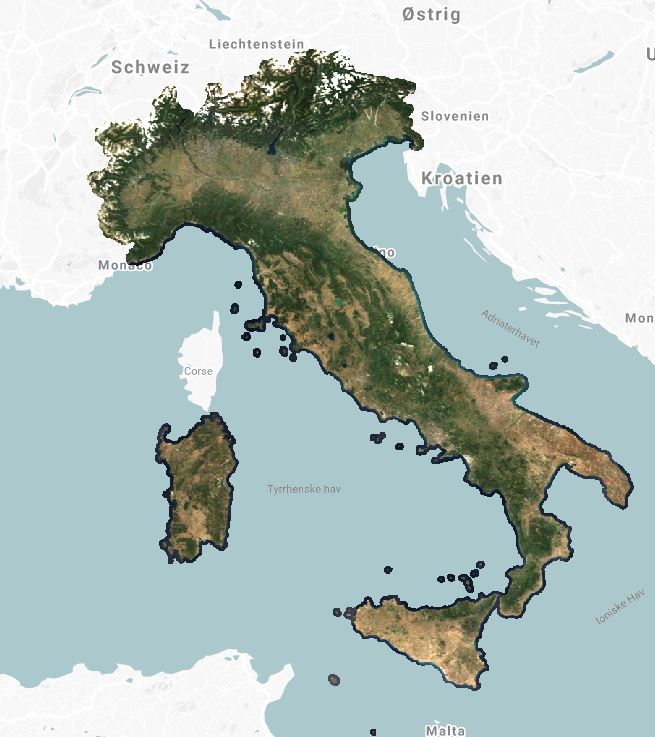
Italy through the clouds
We have compiled a cloud-free composite of Italy, based on thousands of individual Sentinel 2 images from 2018, which can be accessed through our SATLAS site.
Image artefacts, such as orbit path and tile seamlines, cloud and cloud shadow interferences have been removed by our processing, creating a truly analysis-ready data layer, available at full Sentinel 2 resolution.
Use it for land cover classifications or for simple visualizations.
We have also previously produced monthly Sentinel 2 composites for crop type classification in Denmark and made seasonal composites for mangrove mapping in Myanmar.