Worldwide high resolution flood risk and hazard mapping using historical and near real time satellite radar images and digital elevation models . .
Flood and Hazard Mapping
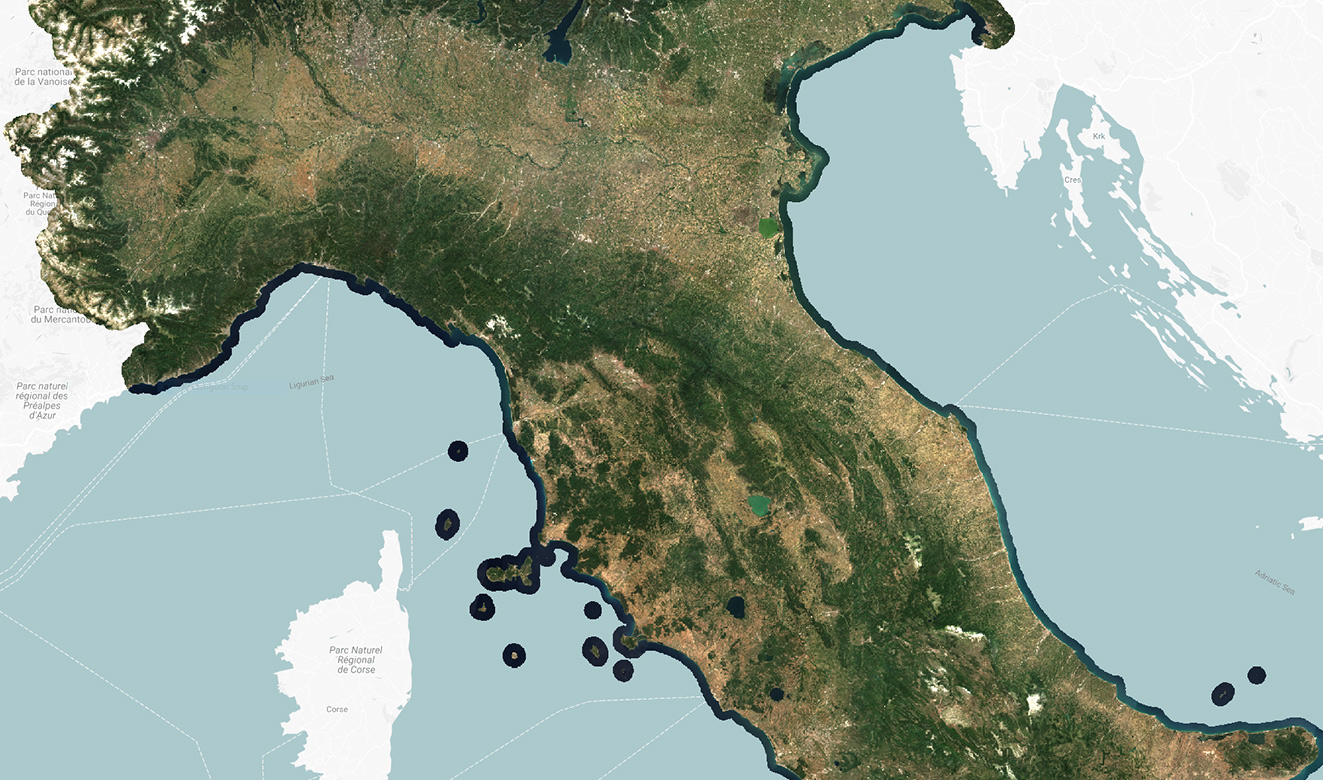
Worldwide high resolution flood risk and hazard mapping
Why is it important?
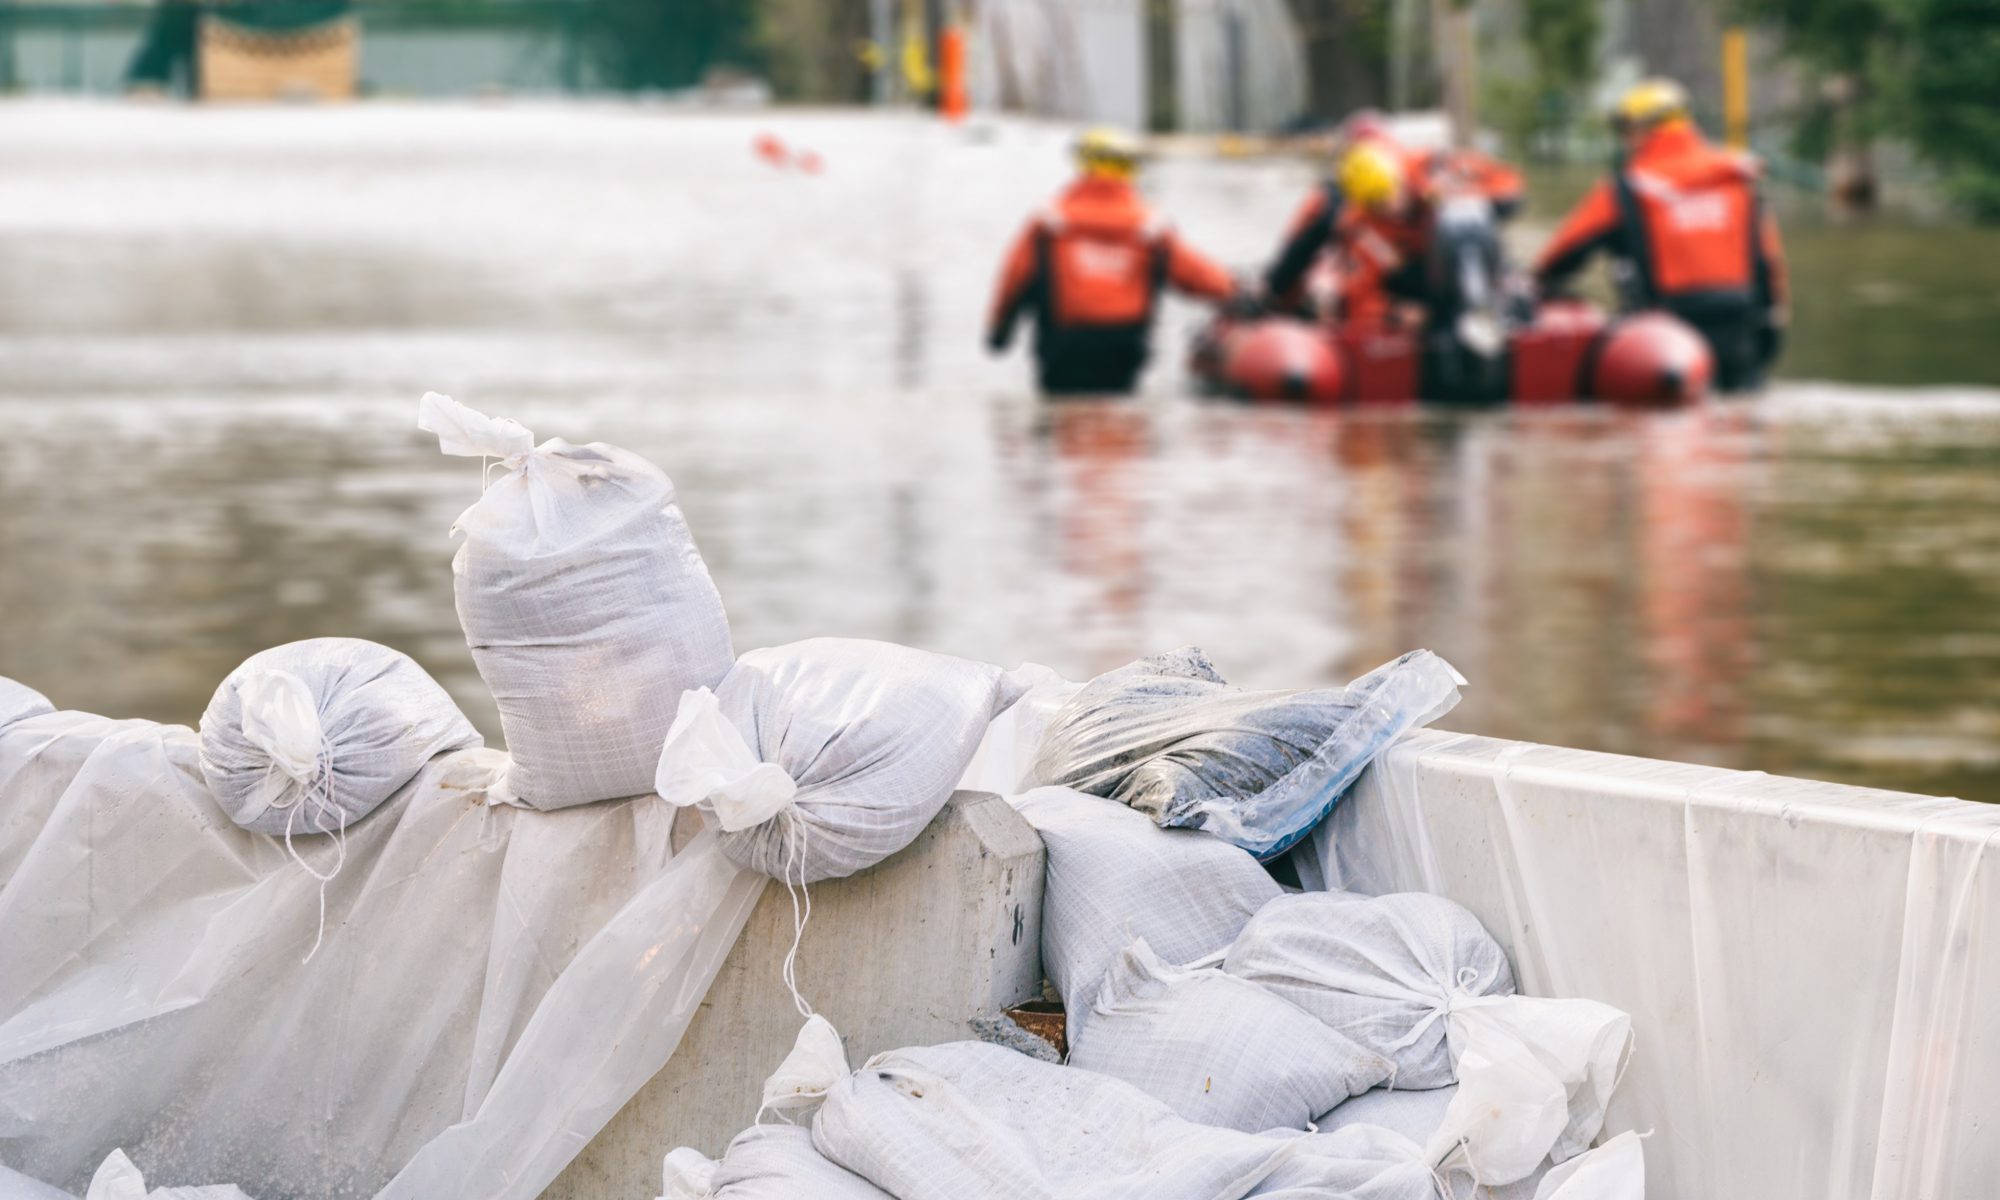
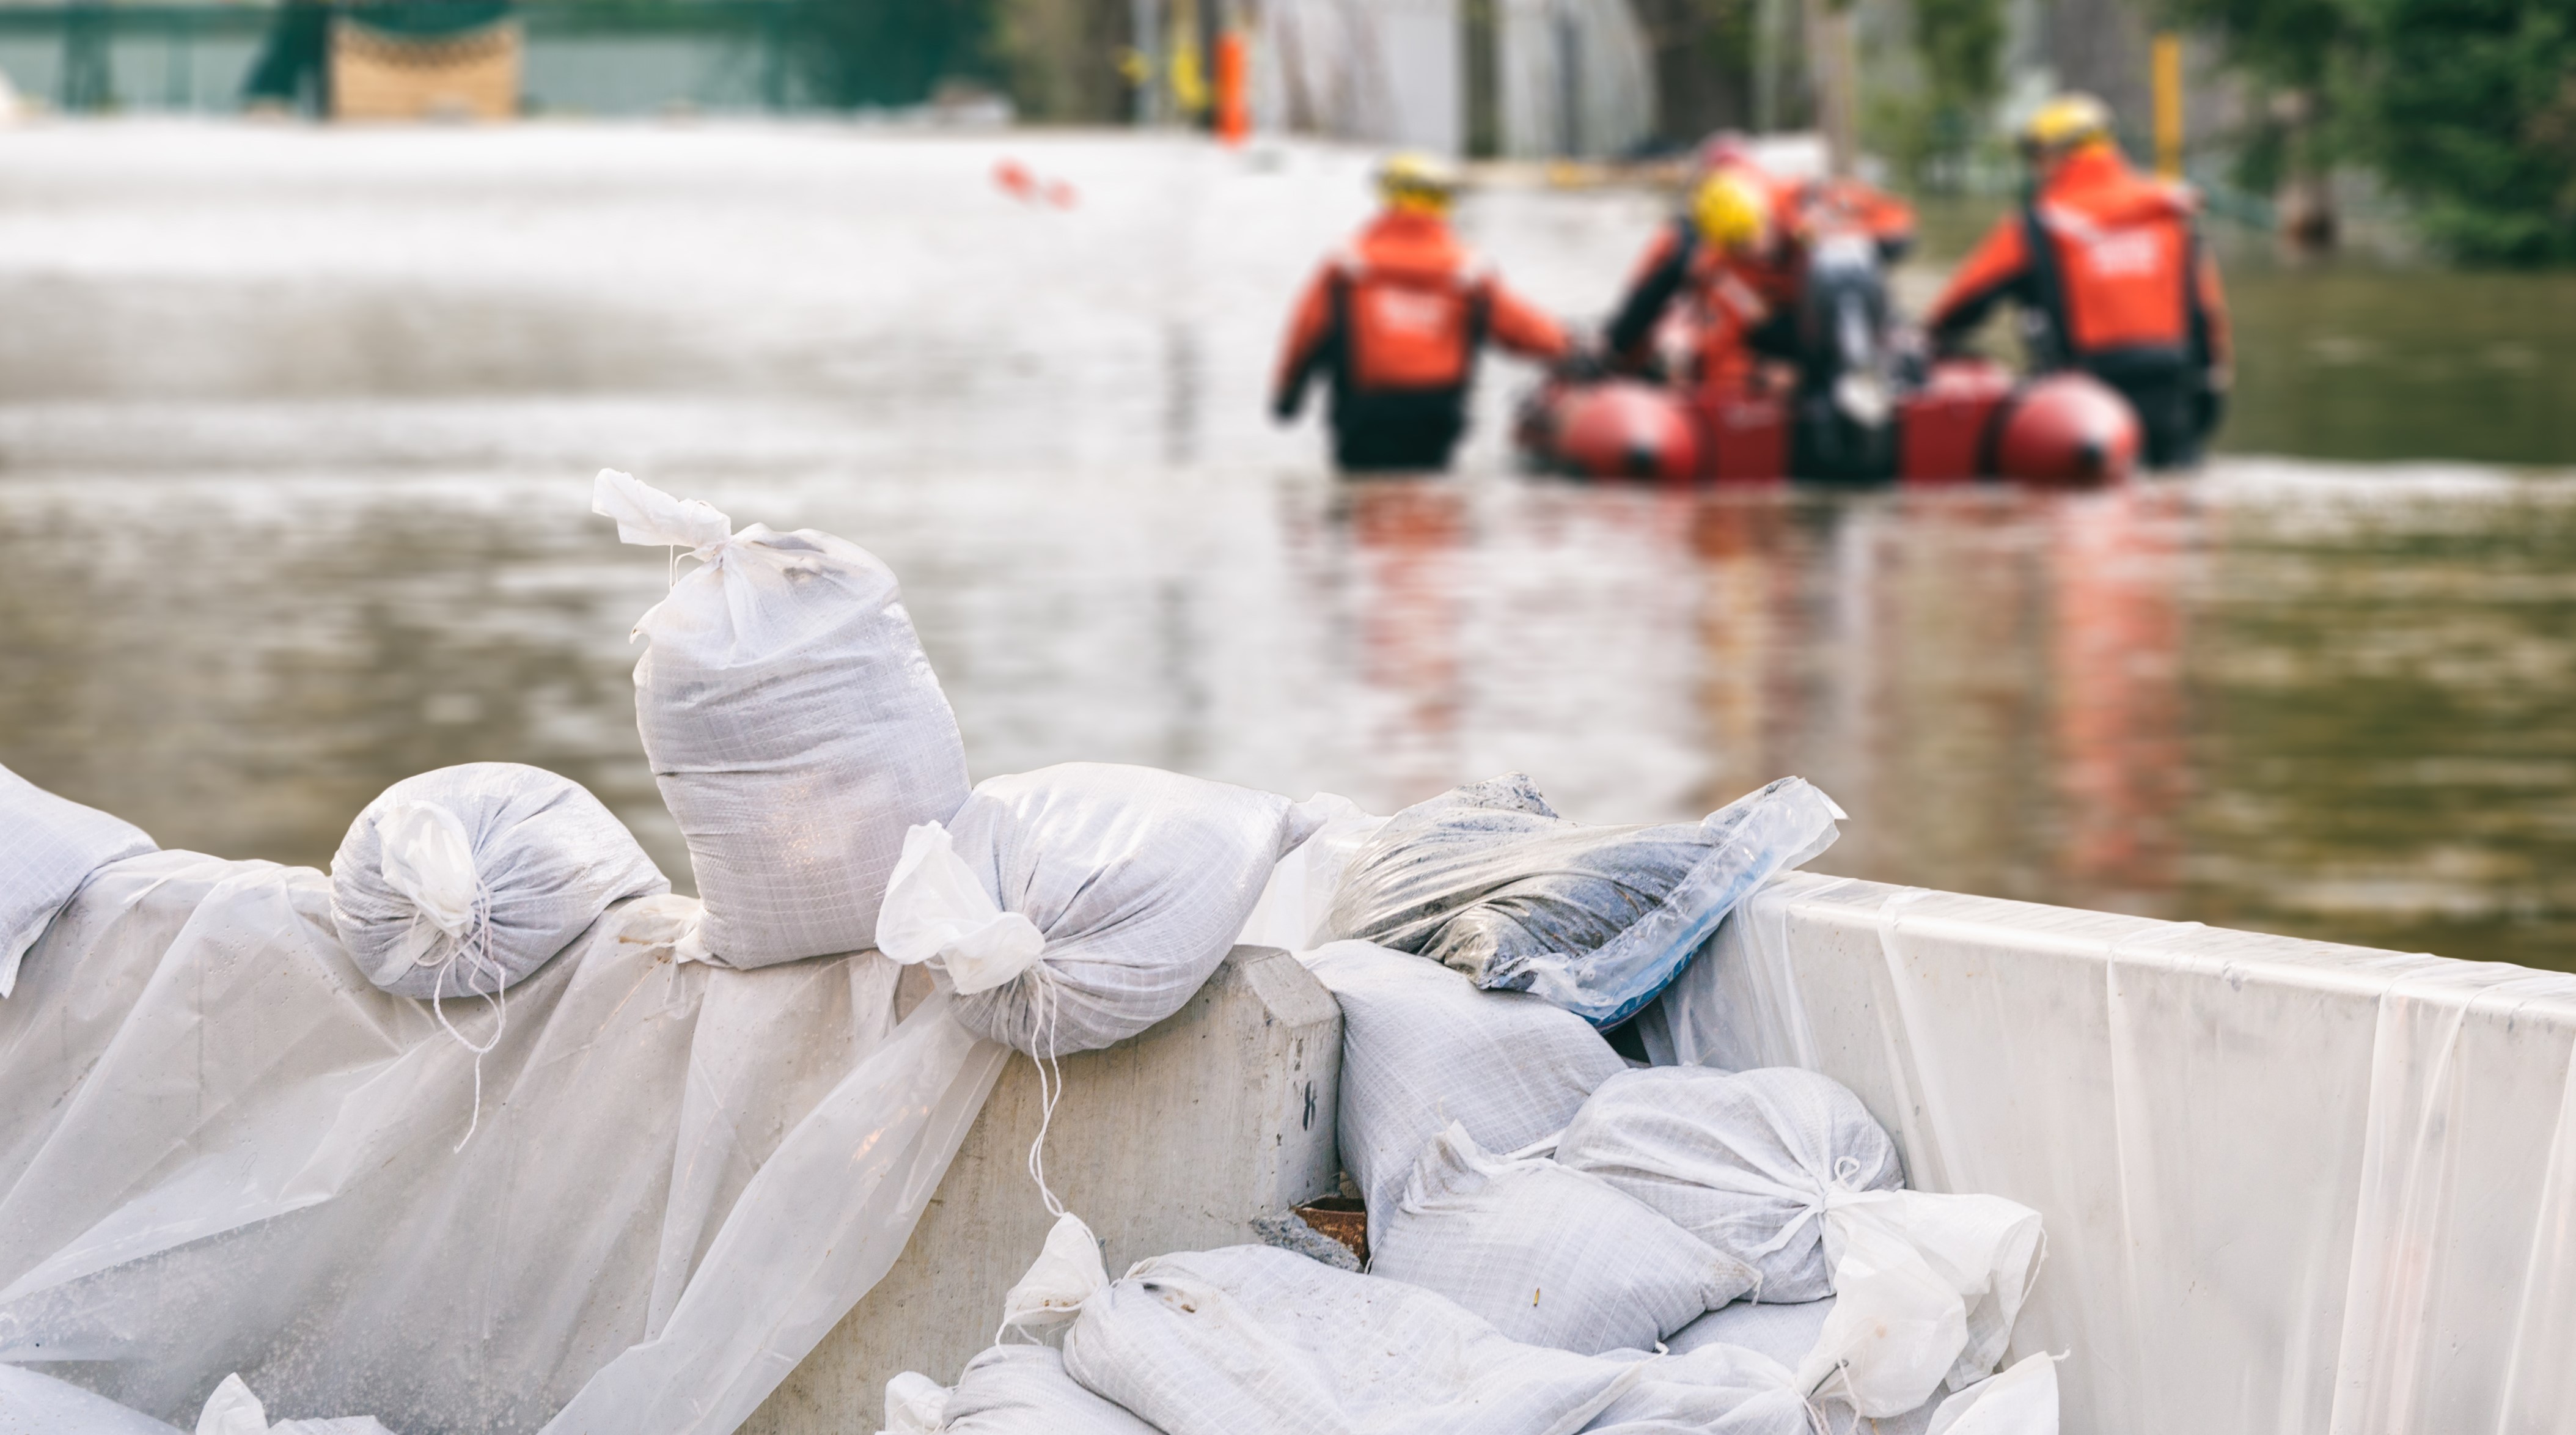
Flood risk and hazard mapping is important for efficient flood risk management. The flood maps are used to prevent flood damages, for land use planning and rescue operations.
How can it help?
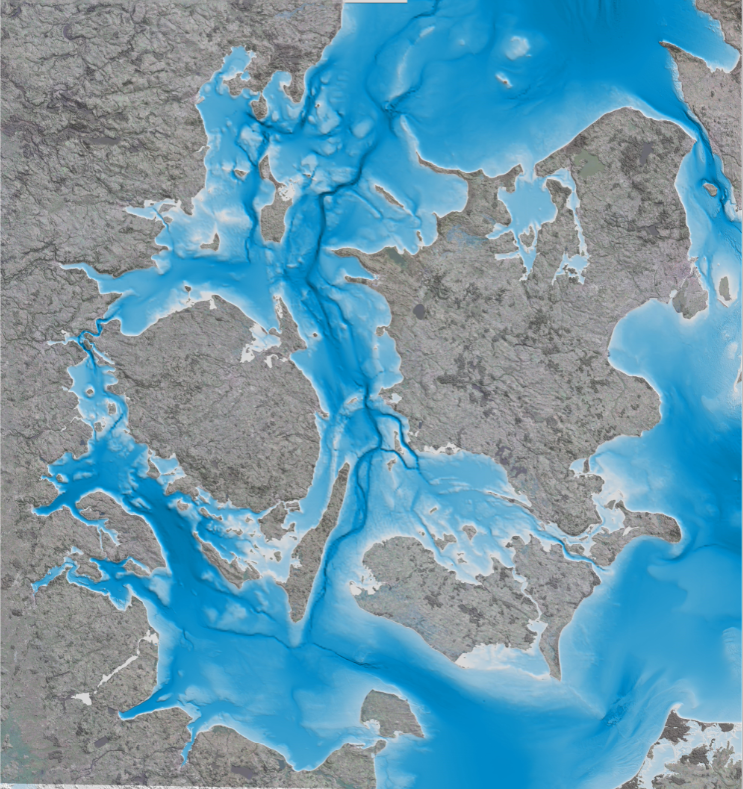
With satellite imagery it is possible to map the extent of an area that has been subject to either a flood or hazard, and assess the damage, getting a full overview of where aid is needed the most.
What you get!
Assess the amount of flooding in near real time by triggering satellites to map flooded areas. The flood hazard map can be acquired a few hours after flooding has occurred and delivered in less than 24-48 hours globally (different solutions apply)
Prevent or limit floods from happening again by mapping historical flood hazards to understand the risks and take mitigating actions based on time series of satellite imagery
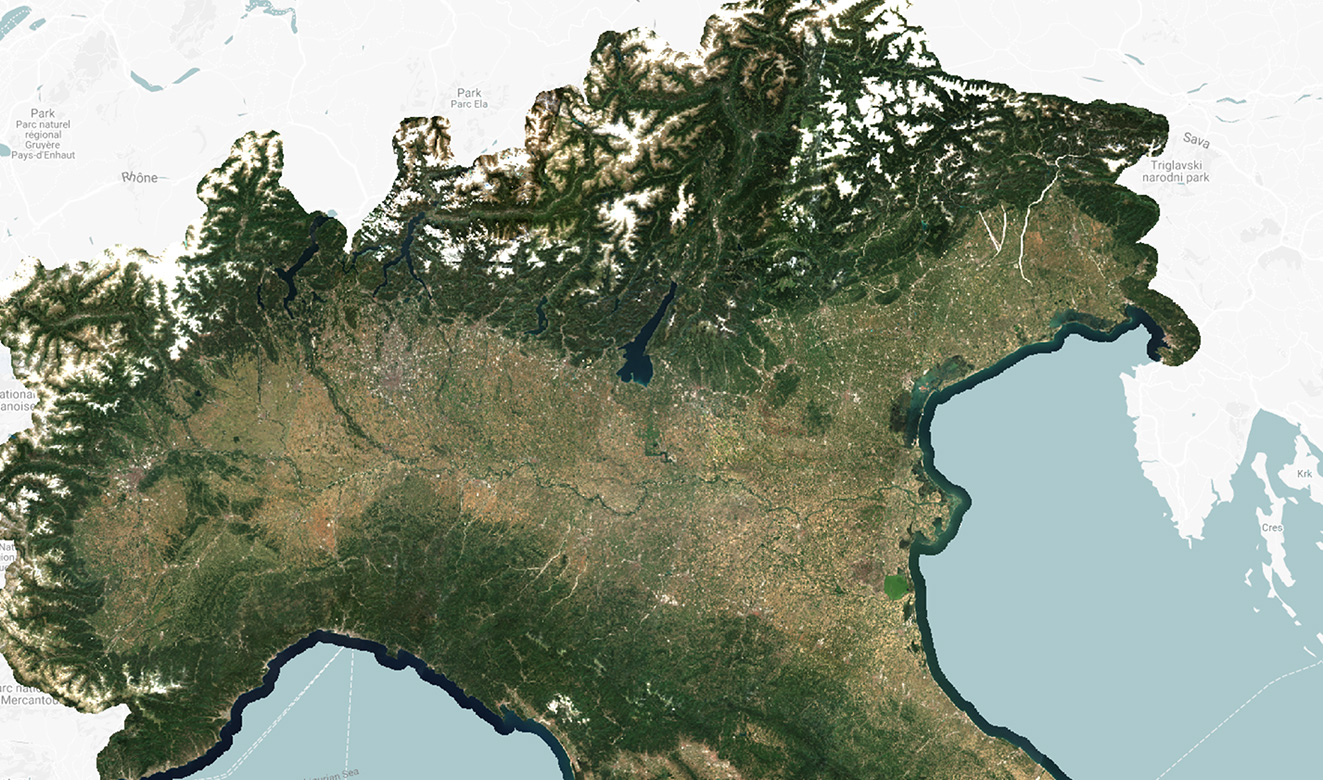
Using high-quality Digital Terrain Models suitable for assessing flood depth coupled with enhancement of Digital Elevation Models through advanced image analysis (feature extraction)

Typical customers?
Urban planners to manage and understand the flood risks in urban planning zones
Civil security agencies to asses the potential severity and frequency of flood losses in emergency situations
NGOs and governments to map, plan and analyse flood risk problems from local to national scales
Specifications
Satellites and our services are global
Get these type of maps daily depending on the overpass schedule of the different satellites
Get information about historical floodings depending on availability of archived imagery
The raw satellite image is typically available within hours after the image acquisition (time needed for analysis and production of maps can vary from a few hours to days depending on size of area)
Price list
EOatDHI part of the DHI GROUP
gras@dhigroup.com
+45 4516 9100
Agern Alle 5,
2970 Hørsholm,
Denmark
CVR: 36466871