Forest height mapping

Forest height mapping:

29 march 2019

One of the many key inputs to wind modelers is forest height information as forests have structural characteristics that affect the wind profile.

We have developed a model to predict forest heights using satellite-based methods. The models take the forest height calibration data and finds relationships between the known heights and the predicted variables from Sentinel and Landsat.

We validated the results by comparing predicted forest height estimations with the validation dataset achieving a Mean Absolute Error (MAE) of about 2 meters, which is well within the acceptable range needed for improved wind flow modelling.

Copyright: DHI GRAS, contains Copernicus Sentinel data (2019)

EOatDHI part of the DHI GROUP

gras@dhigroup.com
+45 4516 9100

Agern Alle 5,
2970 Hørsholm,
Denmark

CVR: 36466871

Devastating cyclone Idai and flood mapping from space

Satellite data analysis

The devastating Idai cyclone and flood mapping from space:

21 march 2019

Satellite data analysis

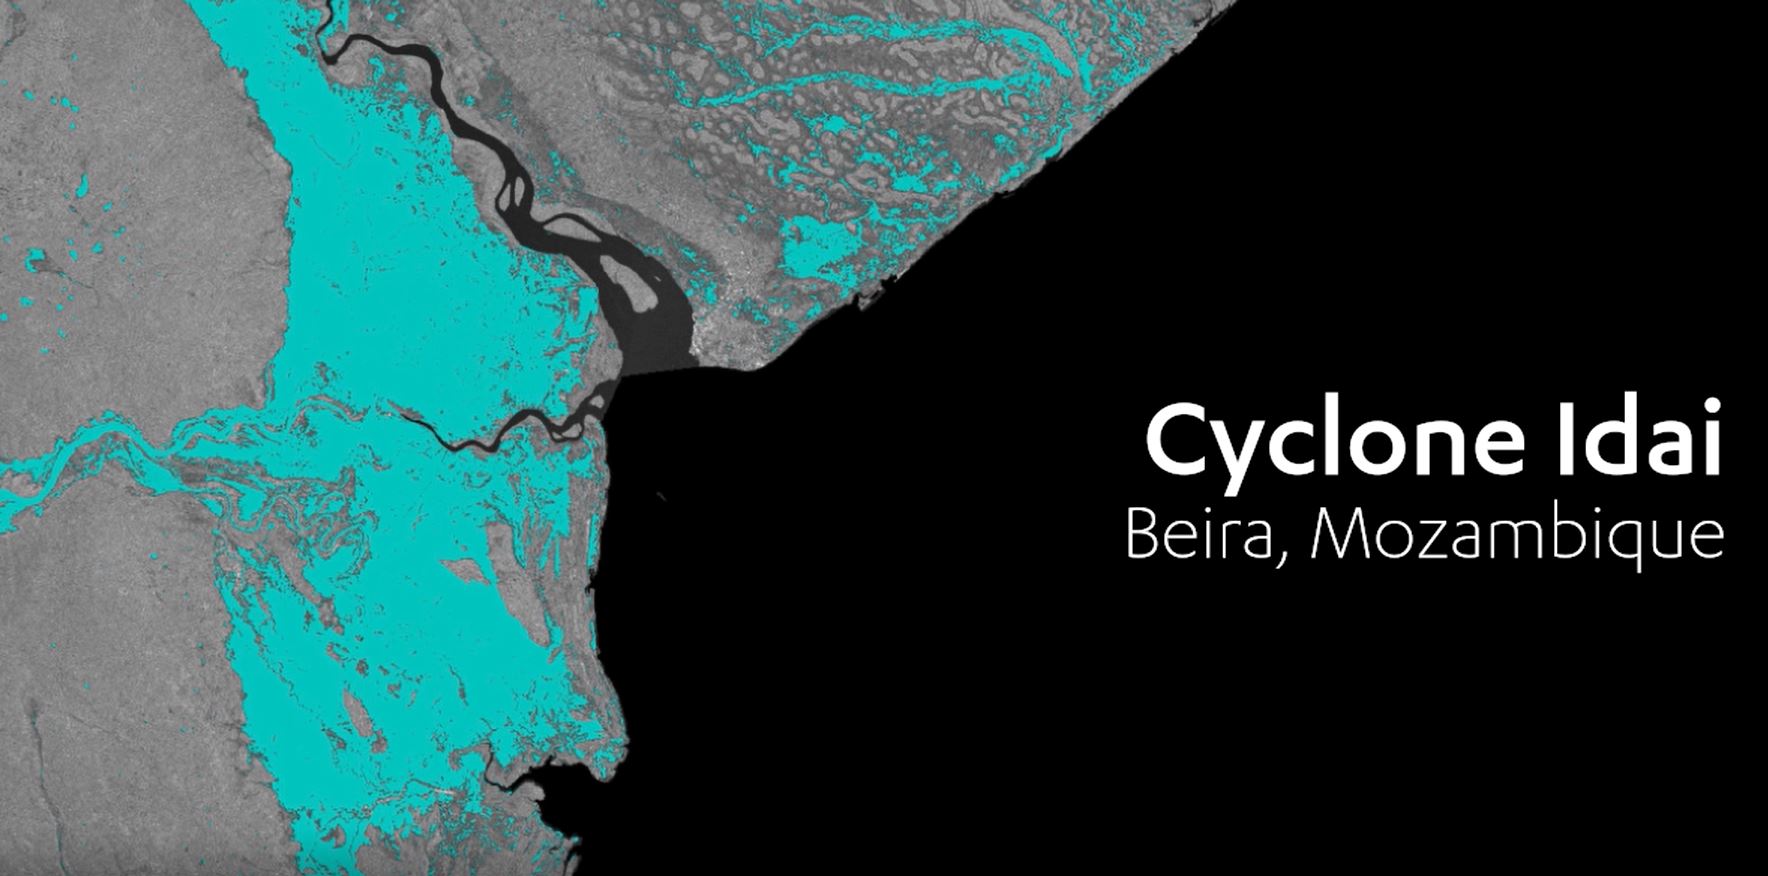
On March 14, the cyclone Idai made landfall on the coast of Mozambique, causing severe rainfall and widespread flooding throughout Mozambique, Malawi and Zimbabwe.

Synthetic Aperture Radar (SAR) images captured by the Sentinel-1 satellite can be used to accurately map the extent of flooding over large geographical areas, using advanced image analysis and processing.

Mozambique’s fourth largest city, Beira in the Sofala province, was one of the most severely affected areas.

By using SAR imagery, we have mapped the flooding’s caused by the cyclone around the city.

These maps are essential for informing authorities and development organizations about the geographical extent and impact from flooding events, in order to target emergency response and development efforts.

Contact us if you want access to the imagery in full resolution or if you are interested in hearing more about flood mapping from space.

As part of the ongoing support to the Zambezi Watercourse Commission (ZAMCOM) our project EO4SD Water has mapped the extent of recent floodings in Mozambique and Malawi, see link below.

Copyright: DHI GRAS, contains Copernicus Sentinel data (2019)

EOatDHI part of the DHI GROUP

gras@dhigroup.com
+45 4516 9100

Agern Alle 5,
2970 Hørsholm,
Denmark

CVR: 36466871
Mapping the Greenland coastal zone

Mapping the Greenland coastal zone

Why is it important?

Remote and challenging regions, such as Northeast Greenland, are difficult to map in detail, and existing topographic maps in Greenland are usually inaccurate with undefined or undocumented features and characteristics.

This makes it difficult to create an Environmental Oil Spill Sensitivity Atlas for NE Greenland, which already exists for West and South Greenland. Such atlases require a topographic base map and information on the physical environment.

With freely and commercially available satellite imagery as well as advanced image analysis coupled with local knowledge it is possible to provide detailed characteristics of the coastal zone in the arctic waters without the safety risks associated with traditional survey methods and at a much more cost-efficient rate, resulting in reliable and objective data.

Project highlights:

Geological and morphological classification of the coastline in NE Greenland aiming to be included in an oil spill sensitivity atlas providing the foundation for a planning tool for when an emergency response is needed

Determining the intertidal zone in the area and calculating depth of shallow waters

All derived products made publicly available through a governmental spatial infrastructure platform

In more detail..

The project used remote sensing approaches to map and characterize the coastal zone within the planned oil spill sensitivity atlas which includes off-shore hydrocarbon areas of interest in NE Greenland.

Using new methods within satellite remote sensing data gives the possibility of providing updated products at a higher resolution in a timely manner.

This work will be highly complementary to the coarser scale but larger regional coverage of the planned atlas, which will be based on existing data. Both products will act as a validation tool for the other, and will also allow for the opportunity to examine advantages and limitations of the different approaches.

The demonstration mapping products have all been based on satellite information that would facilitate an upscaling of the mapping allowing to cover large and poorly mapped regions of the Arctic.

An important part of the existing oil spill sensitivity atlases is the analysis of the oil spill resistance of the coast. General coastal morphology and geology determines how oil spills will be absorbed by the materials along the coast or washed off. This is traditionally done by a manual assessment using available topographic maps and low resolution satellite images in segments of a few kilometers along the coast.

The new analyses would be beneficial to the atlas as it can detect straight or complex coastlines for the identification of risk of possible oil concentrations caught in pocket beaches or other complex morphologies. It can also determine geology types indicating where the oil would be absorbed or rejected and the new information about tidal zones would indicate where oil would be saturated.

The project has been conducted collaboratively with a team of experts from our partners Asiaq, GINR and DCE.

Partners:

EOatDHI part of the DHI GROUP

gras@dhigroup.com
+45 4516 9100

Agern Alle 5,
2970 Hørsholm,
Denmark

CVR: 36466871

Winds of change

Winds of change:

12 march 2018

New satellite-based information proves valuable for the onshore wind industry​

We are now over a year into the exciting Innowind project funded by Innovation Fund Denmark with some very encouraging results on developing better land surface input for wind modelling with the aim to significantly lower current uncertainties for wind estimates.

At DHI GRAS, we have specifically focused on providing better land cover information and forest height estimates as input to surface roughness models.

Working with our project partners including industry professionals such as Vestas, Vattenfall and EMD International and researchers from the technical university, DTU Space and DTU Wind, is highly valued, as it allows us to streamline our research efforts into something of immediate value for the wind industry.

Our initial results are already showing the value of using satellite-derived data in wind modelling providing improved wind resource assessments.

Land cover as input to surface roughness estimates

One of the many key inputs to wind modelers is land cover information as different land cover types can have structural characteristics that affect the wind profile, i.e. forests are more rough than agricultural land etc.


The standard practice by wind modelers is to use generic land cover maps that are not well suited for wind modelling.


An example of this is the Corine land cover that is frequently used by the wind community. This land cover data set has over 40 classes, but most classes are irrelevant for wind modelers and a lot of work goes into merging classes to meaningful groups.


The scale of the land cover map (100m pixel resolution) is furthermore too coarse and although provides good information for regional planning, it often fails to provide finer spatial details required for microscale wind modelling.


Predicted forest height plotted against the observed forest height (validation data).
Land Cover classification can be done automatically with wind industry selected classes. Here illustrated on a Swedish wind farm site.
The classes are converted to Roughness lengths that are used as input in wind models improving wind energy assessments.

Lastly, the Corine data set is only updated every five years. During this time, deforestation and urbanization may have taken place, meaning wind models are often run using outdated land cover data, negatively affecting the models’ performance.

As near real-time satellite imagery and increased computational power are now available, it is about time that the wind industry evolves and improves the quality and resolution of the land cover maps used for wind resource assessments.

The results from a Swedish wind farm show how a few select classes can be converted into input to a surface roughness computation.

Working closely with the project partners, DHI GRAS has developed an automated land cover mapping application that estimates surface roughness via look-up tables (provided by DTU WIND). The model is globally available in 10 meter resolution.​

Forest Height Modelling

Forest height remains poorly accounted for in the majority of wind simulations and relatively little literature is published on the effect of forest height on wind models.


It is, however, commonly acknowledged that forest height has a major impact on the wind-flow, and not accounting for this will influence wind simulations (we refer to our project partner Ebba Delwik for more information on the subject).


In Innowind, we do the first systematic review of this, and have developed a model to predict forest heights using satellite-based methods and freely available data sources, which are far more cost-efficient compared to traditional LIDAR campaigns. The model requires calibration/validation data of known forest heights, together with predictive variables derived from Sentinel and Landsat satellite sensors.


For forest height modelling, we tested several machine learning regression models. The models take the forest height calibration data and finds relationships between the known heights and the predicted variables from Sentinel and Landsat. The results showed that forest height can be estimated effectively using open source data.

We validated the results by comparing predicted forest height estimations with the validation dataset described above achieving a Mean Absolute Error (MAE) of about 2 meters, which is well within the acceptable range needed for improved wind flow modelling.

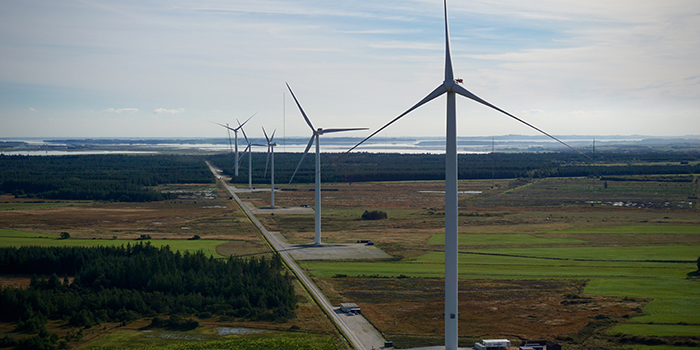
High-resolution image showing a forest at the Osterild site (left), and predicted forest heights derived from the Innowind project.The predicted forest heights agree with results from an in-situ campaign. The predicted forest heights agree with results from an in-situ campaign.

Model results and way forward

The wind industry is showing great interest in the novel data sets from DHI GRAS and it has been shown that using the new products improves the wind energy assessments.

The results will be presented at the upcoming workshop in Østerild, Denmark on March 27.

There are still a few open spots available if you want to join the workshop.

If not, we will share these results later in the year.

Until then, reach out to us if you want to know more or want to test the data in your wind models.
Predicted forest height for macro scale modelling data. The models can be upscaled in more coarse resolution for mesoscale wind modelling.
team-photo-torsten
team-photo-kenneth
Authors: Torsten Bondo (tbon@dhigroup.com) & Kenneth Grogran (kegr@dhigroup.com)

EOatDHI part of the DHI GROUP

gras@dhigroup.com
+45 4516 9100

Agern Alle 5,
2970 Hørsholm,
Denmark

CVR: 36466871
11 new islands have emerged in Denmark

11 new islands have emerged in Denmark:

06 march 2019

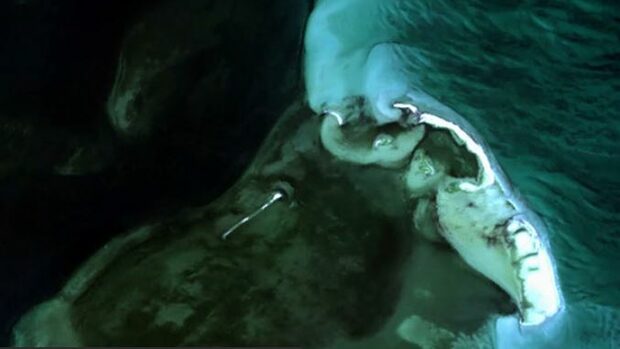
The Danish Ministry of Environment and Food has announced that since 2015, 11 new small islands have been created in Denmark.

The Danish landscape is a relic of the Ice Age, furnished with sand and clay materials, that get pushed around by ocean currents and deposited along the coast. When enough material is collected in one place, a shallow island appears and can over time grow in size, creating ideal breeding grounds for birds due to their isolated location.

The biggest of the new islands, consisting of 36 hectares of mostly sand, is found near Sækkesand, north of the island of Møn, and is already inhabited by the rare Caspian tern and other sea and wading birds.

The birds, however, should not get too comfortable as these islands might be swept away by a large storm or slowly eroded over time. This is part of the natural dynamic nature of the coastal zone.

Satellite-based monitoring of the dynamic coastal zone is one of our core competences, and with data from the Sentinel satellites we can map these changes in detail on a large scale.

The video below documents the development of the new island between 2015 and 2018 - another great example of the usefulness of the free and open Copernicus data.

EOatDHI part of the DHI GROUP

gras@dhigroup.com
+45 4516 9100

Agern Alle 5,
2970 Hørsholm,
Denmark

CVR: 36466871

High Altitude Pseudo Satellites (HAPS)

HAPS High Altitude Pseudo Satellites

Why is it important?

As a future technology, HAPS platforms will open a new market for remote sensing and surveillance. It offers disruptive and complementary applications to services enabled by satellites, terrestrial infrastructures and Remotely Piloted Aircraft Systems (RPAS), at relatively low cost.

Project highlights:

Providing detailed analysis of existing technology gaps and service limitations for  maritime activities.

Identification of system and performance requirements to explore payload components and infrastructure conforming to the requirements of the target user community

Extensive review of earth observation sensors to define a payload package consistent with user and platform specific requirements

In more detail..

Still in the early stage of development, production and operation, High Altitude Pseudo Satellites (HAPS) offers the potential to open a new market for remote sensing and surveillance in the future. HAPS operates at an altitude of approximately 20 km and can observe locations over extended time periods. This enables time critical and continuous monitoring and surveillance over specific areas of interest at relatively low cost.


In the ESA funded project ‘services enabled by HAPS complemented by satellites’, DHI GRAS explores the feasibility and capability of HAPS enabled services to extend the capabilities of satellites and Remotely Piloted Aircraft Systems (RPAS) in the domain of Earth Observation. The main objective is to propose potential services for HAPS that exploit the characteristics of the individual platforms and evaluate the maturity of payload technologies necessary to facilitate service provision.

Through an extensive stakeholder engagement process with potential end-users of HAPS enabled services within maritime operations and surveillance, we established a baseline for a system service definition and payload configuration that addresses the primary technology gaps and service limitations within target user communities. Through this analysis the client gained critical insight into the potential uptake and viability of services enabled by HAPS platforms.

EOatDHI part of the DHI GROUP

gras@dhigroup.com
+45 4516 9100

Agern Alle 5,
2970 Hørsholm,
Denmark

CVR: 36466871

Halfway mark reached for the EO4SDGs project

Halfway mark reached for the EO4SDGs project:​

28 February 2019

This week DHI GRAS has been meeting with Marc Paganini from European Space Agency - ESA (ESRIN) and our partners Geoville, UNEP-WCMC and DHI-UNEP to discuss how the EO for SDGs project has been progressing.

The aim of the project is to maximise the contribution of EO data to the SDG agenda by producing targeted high-quality indicator monitoring guidelines and effective outreach material, and by showcasing the usability of EO data in country demonstration studies and in dialogues with UN stakeholders.

As a follow up, DHI GRAS and ESA also visited FAO for discussions on how EO can contribute to the reporting on SDG indicator “6.4.1 Change in Water Use Efficiency over time”, which is one of the two SDG indicators that are part of the National test case for Uganda.

One main outcome has been a Policy Brief describing how EO can contribute to improvements of the SDG monitoring framework under Agenda 2030 addressed to policy makers, national statistics offices and other SDG agencies. The Policy Brief highlights 17 SDG indicators for which EO has a definite contribution.

The Policy Brief is expected to be released in April.

EOatDHI part of the DHI GROUP

gras@dhigroup.com
+45 4516 9100

Agern Alle 5,
2970 Hørsholm,
Denmark

CVR: 36466871

Test_news_design

06 February 2019

Preparing for the future of the Common Agricultural Policy:

An example of satellite-based catch crop monitoring in Denmark

Growing catch crops after main crops is considered an important management practice for the resilience and long-term stability of agricultural cropping practices. Catch crops are non-profit crops planted a few weeks after the harvest of the main crop and before the next one is sown. This practice imitates the natural ecosystem by preserving soil nutrient resources such as nitrogen and phosphorous, increasing soil fertility and carbon sequestration, and reducing soil erosion.

In Europe, catch crops are part of the second pillar of the Common Agricultural Policy (CAP), an agricultural subsidy system for farmers, where farmlands of more than 15 hectares generally have to designate 5% of the arable land as “ecological focus areas” in order to comply with the provision. Growing catch crops such as fodder radish, yellow mustard and different grasses are one way to live up to this requirement.

EU regulations provides rules for the financing of CAP expenditure and for relevant management and control systems, requiring Member States to put an integrated administration and control system in place for the management of most of the EU agricultural spending. In Denmark, this is managed by the Danish Agricultural Agency (DAA), whose work involves many field-based controls and heavy administrative burdens.

Agricultural monitoring using satellite-based information serves as an efficient supplement to monitoring efforts performed by national agencies. At DHI GRAS, we have completed several projects for the DAA with promising results.


Our latest study focused on catch crop monitoring and maize harvest detection

One of the major challenges to large area monitoring using satellite imagery is that the data is highly irregular in time. For example, any two fields in Denmark will have very different imagery available, due to different orbit overpass times over each field, and because of gaps caused by cloud cover. To solve this challenge, we developed innovative processing techniques so that all available cloud-free imagery over Denmark can be used seamlessly in machine learning algorithms that can accurately map catch crops.

We tested a number of advanced machine learning and deep learning methods to optimize processing time and mapping accuracy – gathering valuable knowledge of current technological capabilities and which areas require further methodological development.

We’ve found great potential in using satellite imagery in connection with the agricultural industry especially for farmers, who can look forward to less paperwork and fewer control visits by the DAA.

Although information from satellites cannot completely replace field visits, it can be used to indicate to the DAA where they should focus their field visits.

By using satellites, we are taking a natural step towards the future of agricultural monitoring and are making the first experiences which over time will make it easier to live up to CAP regulations, both as a farmer and as a national agency.

EOatDHI part of the DHI GROUP

gras@dhigroup.com
+45 4516 9100

Agern Alle 5,
2970 Hørsholm,
Denmark

CVR: 36466871