WINDSIGHT - IMPROVING THE ACCURACY OF WIND RESOURCE ASSESSMENTS THROUGH EO SOLUTIONS:
1 december 2020
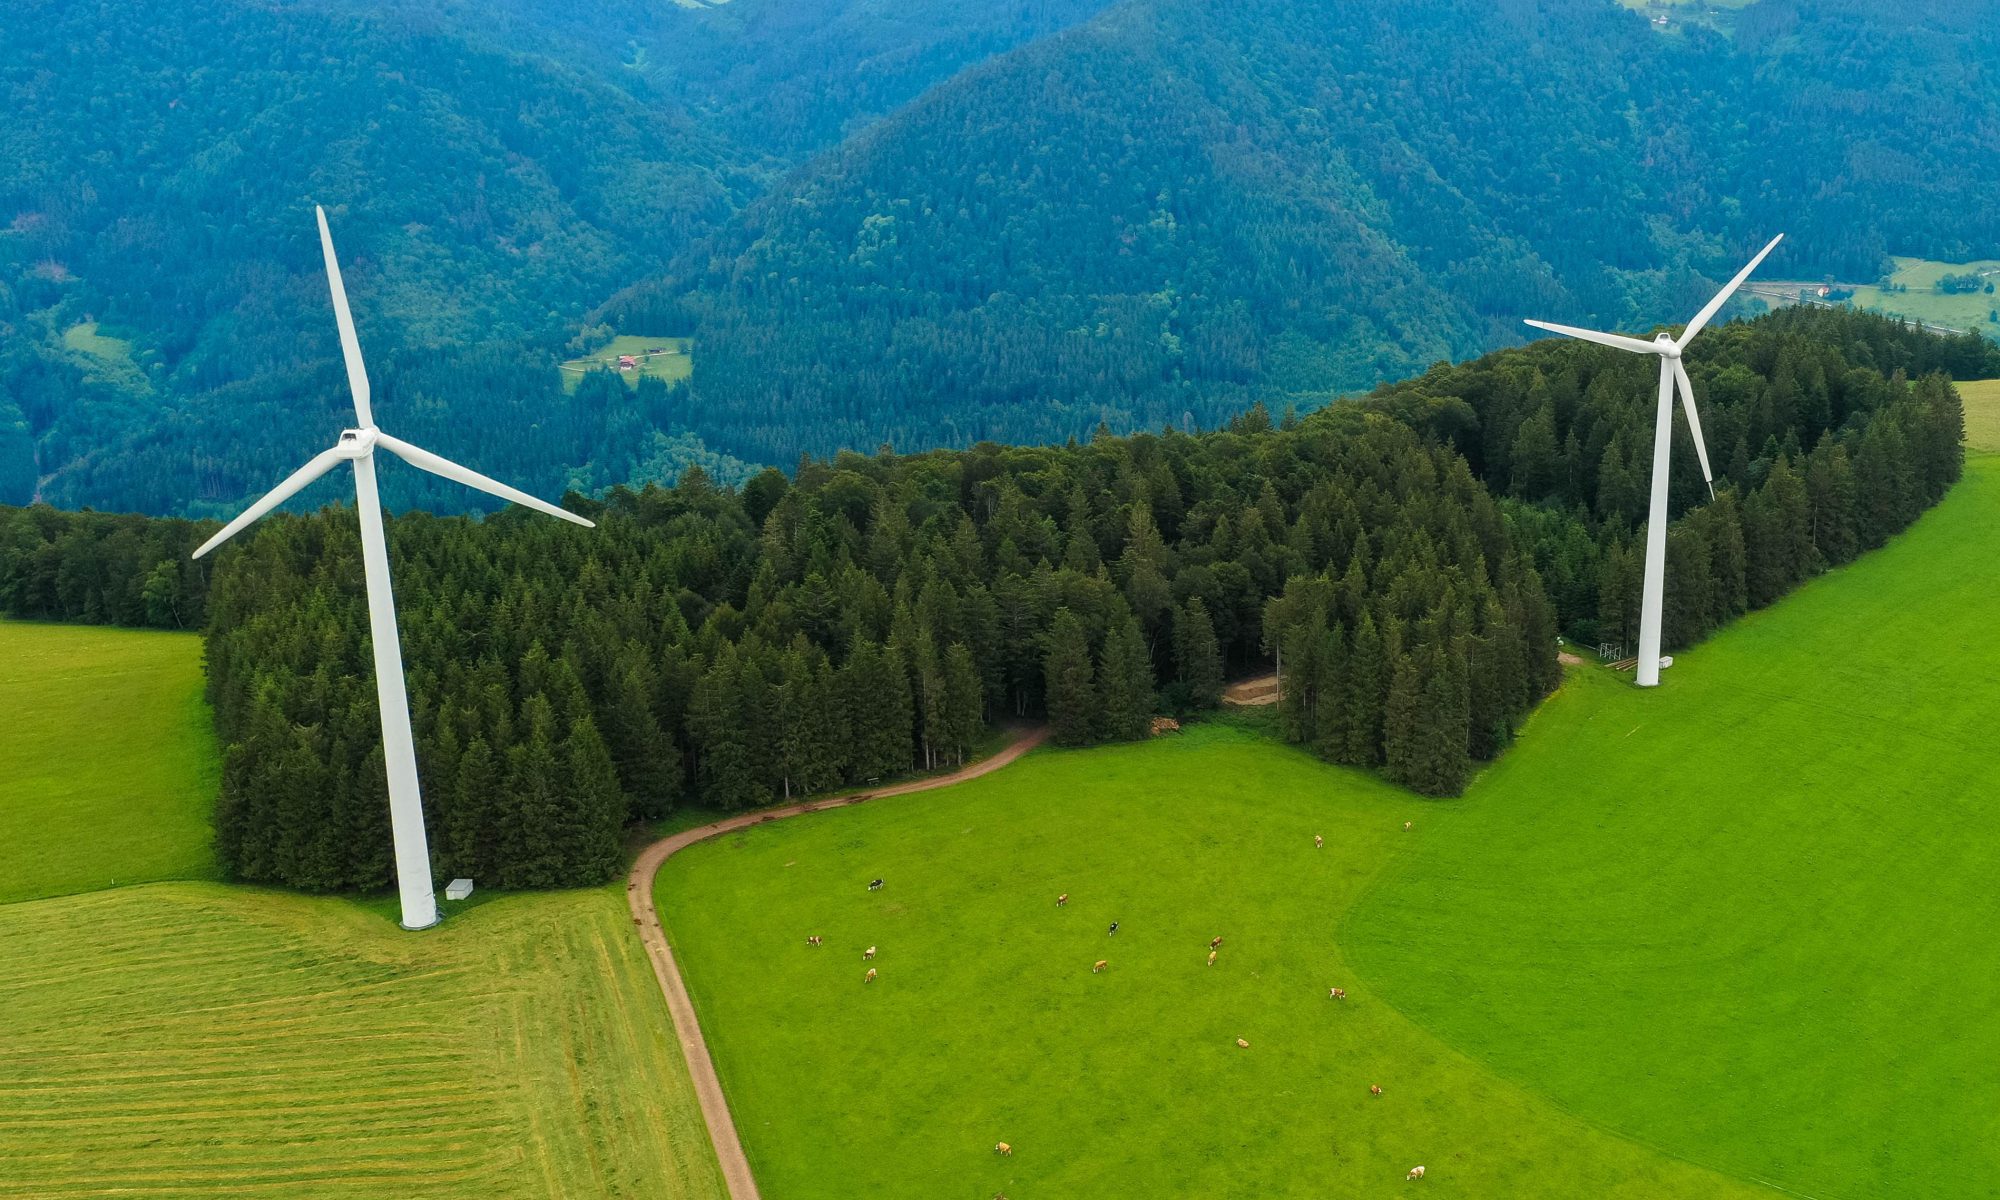
Frictional forces due to land properties (such as terrain height and the physical structure of vegetation (height, density, etc.)) influence the strength and direction of the wind at the surface. Therefore, reliable, and timely data and information on such properties is critical, to accurately assess the availability of wind resources. However, assessments of wind energy resources is a highly complex and time consuming process – ultimately relying on consistent, accurate and timely models and input data. Yet, in many cases, especially in forested sites, surface data on roughness and forest height is inaccessible or simply not available and this may impact the ability of wind modelers to accurately assess wind resources.
Satellites provides new opportunities for characterizing surface properties and estimating surface roughness
The launch of many new satellite missions that routinely monitor land surfaces, combined with the latest advances in machine learning technology, has underpinned new ways to accurately and regularly map and monitor surface properties and surface roughness, thus addressing the existing data gap.
In this blog we will describe how we at DHI, together with the wind industry, has developed a new portfolio of surface roughness products, based on the latest satellite data and machine learning technology, and tested them for the wind community.
The high resolution land cover product is automated to ensure consistent, reliable and timely global delivery
The forest height product can be delivered globally and replace most needs for LIDAR campaigns
From explorative research to a mature and robust solution
In 2020, the 3 year long Innovation Fund Denmark project ‘Innowind’ by VESTAS, Vattenfall, EMD International A/S, the Technical University of Denmark (DTU) and DHI GRAS concluded.
This project examined the effect of using satellite-based input layers for flow modeling at the meso- and microscale and trialed these data layers at a selection of global sites, where ground truth observations were available and wind turbines are planned or in operation. Forested sites were particularly in focus, as they have the strongest impact on wind flow and represent 75% of new land-based wind energy developments. The chain of models for resource assessment was adapted to utilize novel satellite-based input layers.
Introducing WindSight
InnoWind progressed the assessment of wind energy resources by working with the EU/ESA Copernicus satellite data and products within aerodynamic flow models. Copernicus Global and pan-European products, describing vegetation properties such as forest type and density, was used in combination with digital elevation models to derive the surface drag force. This new approach could eliminate indirect and subjective assessments of surface properties and reduce the uncertainty modelled wind resources. Further, it provides a pathway to more accurate, automated and consistent assessments at different sites.
As a result of three years’ development efforts, a new satellite-based product portfolio entitled ‘WindSight’ was developed, aiming to improve the accuracy of wind resource assessments.
The high resolution forest density product can be delivered globally and replace most needs for LIDAR campaigns
The high resolution land trend product provides a powerful tool to uncover historic trends and dynamics and predict future forest cover change
The very high resolution elevation products are available globally and provides a cost-efficient alternative to LIDAR based elevation models.
5 different products in one tailored data package
DHI WindSight includes 5 different high-quality and high-resolution data products on land cover, key forest characteristics, historical and future changes, topography and surface roughness – tailored for wind sites anywhere in the World.
Land Cover: The land cover product is generated in near real time using best in class satellite imagery to provide up-to-date, reliable and accurate information about land cover types, in grid sizes up to 10 meters
Forest products: Based on current or historical image analysis of high- satellite imagery, the forest products provide detailed insight on current and historical forest height and forest density in grid sizes of 20 meters.
Historical and future changes: Based on time-series analysis of high-resolution satellite imagery, the land change product provides information about past, current and future forest cover and site conditions.
Very high-resolution (VHR) elevation layers: The VHR elevation and topography data layers are provided in grid sizes down to 1 meter, comparable in quality to more expensive LIDAR based elevation models.
Surface roughness: Using state-of-the-art models, surface roughness data is generated through conversion of the forest density, land cover and forest height data products. These advanced roughness length layers are compatible as input for a wide range of softwares and modelling methods including windPRO, WaSP and CDF tools
How do we get the data out there? - still learning what the modelling community wants
We have now tested WindSight for almost 20 sites. The feedback we get from the modelling community is that the improved surface data layers from WindSight seem to decrease the cost of wind energy development by increasing the precision of assessment of wind resources and lowering uncertainty in the planning phase.
We thereby think WindSight will challenge current industry practice by a new approach where surface properties are derived directly from satellite-based map layers. This eliminates indirect and subjective assessment through field visits or interpretations of optical imagery (e.g. Google Earth).
This is all very good and a big step forward in providing more accurate base layers for wind modeling. But what does the wind modelling community think? We have talked to some companies but certainly not all. In order to get this technology further adopted by the modelling community we still struggle to understand what the global community needs when it comes to wind model input data. Some of the questions we need answers to are:
Are LIDAR campaigns always required in forest areas and can WindSight replace LIDAR campaigns?
Do wind modelers develop the surface roughness layers or forest height data from the LIDAR data or from other data types?
How often do wind modellers need LIDAR data on forest heights and surface roughness?
How frequent and fast would wind modelers mostly like to access the data?
To help us shape a product that best fits your needs and requirements, we hope that you will answer our short survey by clicking the button below.
The high resolution surface roughness map has been tested in several sites globally and shows significant improvements in wind flow modelling especially in forested sites
SATELLITE-BASED SOLUTIONS TO SUPPORT THE OFFSHORE WIND INDUSTRY:
20 december 2019
Offshore wind has experienced tremendous growth in recent years as an attractive and clean energy alternative. However rigorous environmental legislation and a harsh and dynamic environment require thorough and meticulous planning as well as continuous operational monitoring of windmill installations and the dynamics of the surrounding water bodies.
The majority of the data and information needed to plan, construct and operate offshore wind farms is costly, time consuming and risky to collect, requiring rigorous field campaigns and expensive equipment.
Cost-effective and reliable solutions from space
Satellite-derived data products and services provide a powerful, low cost and efficient alternative to supplement or replace traditional monitoring solutions, by delivering up to date insight on the dynamics of the seabed and conditions of the environment around offshore wind farms. Our key offerings include satellite-based approaches to map and monitor shallow water bathymetry; aquatic vegetation; geomorphological dynamics and sedimentary variations around offshore wind installations. We also provide critical input data components to support offshore wind cable landfall assessments, such as coastal dynamics, digital terrain models and imagery for site planning.
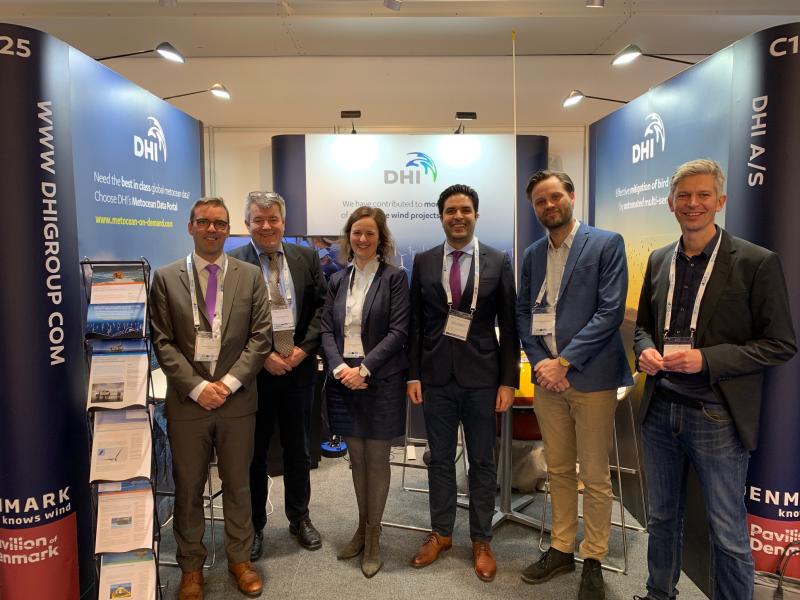
Rasmus Borgstrøm (second from the right) and Torston Bondo (Far right) at WindEurope 2019
Growing interest in satellite-based products among major stakeholders
We have experienced an increased uptake and interest in our products and services, by stakeholders involved in the offshore wind industry, which was most recently solidified at the WindEurope Offshore conference in Copenhagen last month. The conference is a leading platform for peer to peer discussions with industry leaders and specialists and a unique opportunity to grasp the latest industry trends. We were represented by our Managing Director, Rasmus Borgstrøm and Business Development Manager, Torsten Bondo and their discussions with peers, potential clients and collaborators indicates a significant continued interest in our Earth Observation products, designed to support the monitoring needs of offshore wind operators.
Continued engagement with offshore industry partners and clients in 2020
As we are approaching the end of 2019, we are reflecting on an upbeat year where we have been excited to experience this attention and acceptance of our products and services by clients in the offshore wind industry, and we are looking forward to 2020 where we will continue to push our reliable and low-cost tools to support offshore wind farm operations.
See the video to below for further information and insight on how our products match the needs of clients and stakeholders in the offshore wind industry.
The extra information has provided a huge leap forward in computer vision capabilities and is used to more accurately identify specific objects and land cover classes of interest.
The application of Deep Learning (DL) to analyse satellite imagery is paving the way for the Earth Observation field to reinvent itself.
This can extend the reach through novel idea-thinking to solve new challenges and optimise traditional ways of monitoring and mapping.
Thanks to the exponential growth of active satellites together with advancements in Big Data and Cloud Computing, information from space is becoming more accessible.
This allows for enormous quantities of data to be stored and analysed at a much faster pace.
At DHI GRAS mapping of specific features of interest and land cover is a key service delivery. We are experts in extracting information from satellite imagery to meet our client’s needs.
A common approach has been to train classical machine learning algorithms (e.g. Support Vector Machine or Random Forest) to label each pixel in a satellite image.
However, one of the shortcomings of this approach is that each pixel in the image is classified independently of its neighbouring pixels – meaning the spatial context in imagery is not considered.
The main advantage of Deep Learning algorithms is that they can recognize patterns, shape, and context in imagery, and use this to better map different objects of interest.
By doing so, they use not only the spectral information from pixels, but also the surrounding spatial information that is associated with objects.
Land Cover Mapping
Our Deep Learning Lab has seen significant improvements in land cover mapping using latest DL algorithms for image segmentation.
For large area mapping we take advantage of imagery provided by the European Space Agency’s Sentinel satellites. These satellites deliver state-of-the art optical and radar imagery free of charge for the entire globe – which have revolutionized mapping capabilities since they were launched in 2015.
Using this imagery in combination with Deep Learning has greatly improved our capabilities in mapping specific land cover or land use types including water & wetlands, crop-types, irrigated areas, forests and many more.
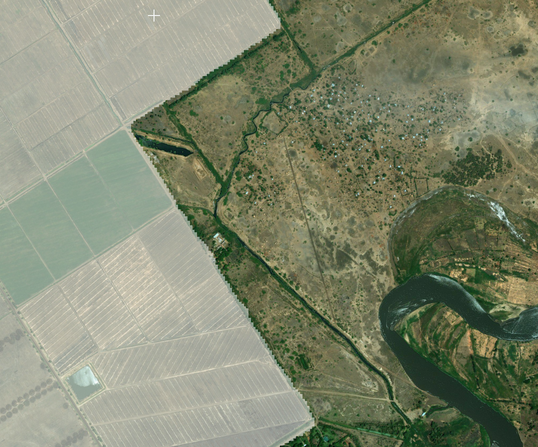
Mapping of irrigated cropland in Malawi using Convolutional Neural Networks (CNN) and Semantic Segmentation.
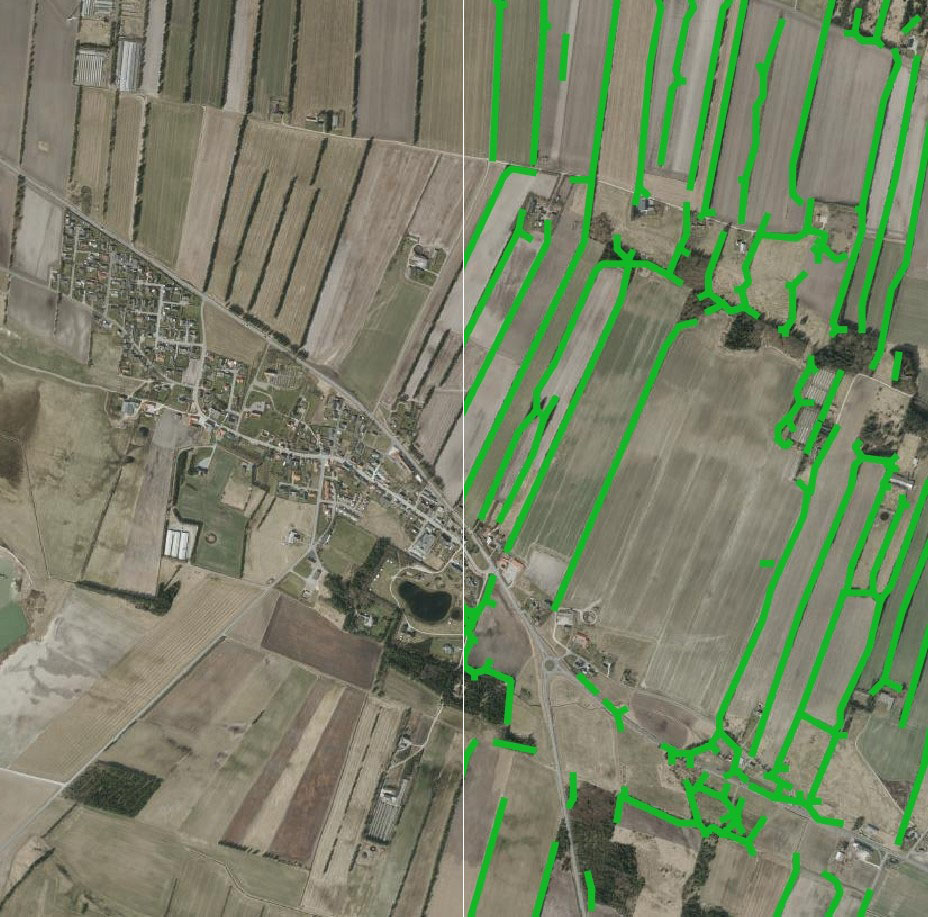
Mapping ‘wind breaks’ in open landscapes using Deep Neural Networks. Satellite imagery (left), predicted windbreaks (green outline) from the Deep Neural Network (right).
Mapping wind breaks in open landscapes
One of the latest innovations we have been working on is mapping ‘wind breaks’ in open landscapes, relevant for the wind power industry. Wind breaks are barriers such as tall fences, walls and hedges located throughout the landscape which can increase the surface roughness and drag, and decrease the expected wind flow. Information on the location of windbreaks is therefore important when making wind flow models and planning the location of wind turbines.
Interestingly, this DL network was originally designed for biomedical image segmentation, however it has proved highly useful when applied to satellite imagery. We trained and validated the model on Sentinel-2 imagery using a sample of known wind breaks throughout Denmark, with impressive results. Once identified, these wind breaks can then be used for better estimation of surface roughness.
Object Detection
We have also had much success with using DL for object detection and recognition in satellite and aerial images. We have found that many of the DL models used in other fields such as biomedical imaging and self-driving cars, work equally well on satellite images, with little adaptation.
Furthermore, we have been able to use transfer learning, to leverage models pre-trained on more general image datasets, . This is great news, since it enables us to get good results with comparatively little training data.
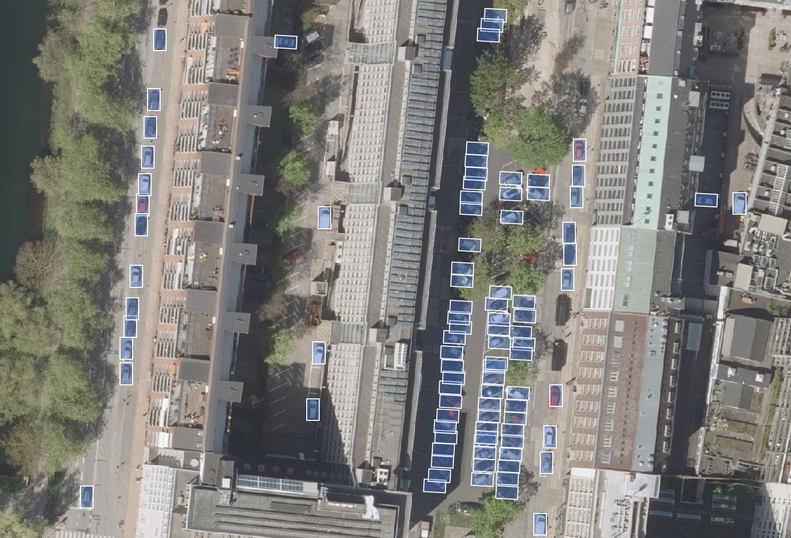
In short, this means that we can detect objects such as cars, solar panels, swimming pools, etc. with high accuracy and short turnaround for delivery, while only requiring a small amount of training data even for larger areas.
Locating solar panels on rooftops using Deep Learning.
Tracking cars in urban areas with Region-based Convolutional Neural Network (R-CNNs).
Powerful new advancements
Modern Earth Observation holds great potential to bridge the gap between Remote Sensing and AI, and allows for users to gain insights like never before.
At DHI GRAS, we are intrigued by the developments we are seeing in this field.
We are working hard in our Deep Learning Lab to explore what is possible and inspire our clients to think in new ways. Our aim is to create awareness of how DL has the potential to significantly optimize existing workflows.
We welcome all ideas – so if you have an object you would like us to map, we can be reached at gras@dhigroup.com.
Authors: Philip Graae (phgr@dhigroup.com) & Kenneth Grogran (kegr@dhigroup.com)
New satellite-based
information proves valuable for the onshore wind industry
We are now over a year into the exciting Innowind project funded by Innovation Fund Denmark with some very encouraging results on developing better land surface input for wind modelling with the aim to significantly lower current uncertainties for wind estimates.
At DHI GRAS, we have specifically focused on providing better land cover information and forest height estimates as input to surface roughness models.
Working with our project partners including industry professionals such as Vestas, Vattenfall and EMD International and researchers from the technical university, DTU Space and DTU Wind, is highly valued, as it allows us to streamline our research efforts into something of immediate value for the wind industry.
Our initial results are already showing the value of using satellite-derived data in wind modelling providing improved wind resource assessments.
Land cover as input to surface roughness estimates
One of the many key inputs to wind modelers is land cover information as different land cover types can have structural characteristics that affect the wind profile, i.e. forests are more rough than agricultural land etc.
The standard practice by wind modelers is to use generic land cover maps that are not well suited for wind modelling.
An example of this is the Corine land cover that is frequently used by the wind community. This land cover data set has over 40 classes, but most classes are irrelevant for wind modelers and a lot of work goes into merging classes to meaningful groups.
The scale of the land cover map (100m pixel resolution) is furthermore too coarse and although provides good information for regional planning, it often fails to provide finer spatial details required for microscale wind modelling.
Predicted forest height plotted against the observed forest height (validation data).
Land Cover classification can be done automatically with wind industry selected classes. Here illustrated on a Swedish wind farm site.
The classes are converted to Roughness lengths that are used as input in wind models improving wind energy assessments.
Lastly, the Corine data set is only updated every five years. During this time, deforestation and urbanization may have taken place, meaning wind models are often run using outdated land cover data, negatively affecting the models’ performance.
As near real-time satellite imagery and increased computational power are now available, it is about time that the wind industry evolves and improves the quality and resolution of the land cover maps used for wind resource assessments.
The results from a Swedish wind farm show how a few select classes can be converted into input to a surface roughness computation.
Working closely with the project partners, DHI GRAS has developed an automated land cover mapping application that estimates surface roughness via look-up tables (provided by DTU WIND). The model is globally available in 10 meter resolution.
Forest Height Modelling
Forest height remains poorly accounted for in the majority of wind simulations and relatively little literature is published on the effect of forest height on wind models.
It is, however, commonly acknowledged that forest height has a major impact on the wind-flow, and not accounting for this will influence wind simulations (we refer to our project partner Ebba Delwik for more information on the subject).
In Innowind, we do the first systematic review of this, and have developed a model to predict forest heights using satellite-based methods and freely available data sources, which are far more cost-efficient compared to traditional LIDAR campaigns. The model requires calibration/validation data of known forest heights, together with predictive variables derived from Sentinel and Landsat satellite sensors.
For forest height modelling, we tested several machine learning regression models. The models take the forest height calibration data and finds relationships between the known heights and the predicted variables from Sentinel and Landsat. The results showed that forest height can be estimated effectively using open source data.
We validated the results by comparing predicted forest height estimations with the validation dataset described above achieving a Mean Absolute Error (MAE) of about 2 meters, which is well within the acceptable range needed for improved wind flow modelling.
High-resolution image showing a forest at the Osterild site (left), and predicted forest heights derived from the Innowind project.The predicted forest heights agree with results from an in-situ campaign. The predicted forest heights agree with results from an in-situ campaign.
Model results and way forward
The wind industry is showing great interest in the novel data sets from DHI GRAS and it has been shown that using the new products improves the wind energy assessments.
The results will be presented at the upcoming workshop in Østerild, Denmark on March 27.
There are still a few open spots available if you want to join the workshop.
If not, we will share these results later in the year.
Until then, reach out to us if you want to know more or want to test the data in your wind models.
Predicted forest height for macro scale modelling data. The models can be upscaled in more coarse resolution for mesoscale wind modelling.
With an increasing number of satellites launched in recent years and advances in the image analysis methods, remote sensing data has proven itself as a cheap and very valuable source of information for planning, construction and monitoring of offshore wind farms (OWF).
Mapping of water depths and seabed dynamics
Understanding of the seabed dynamics is highly relevant when planning to reduce potential risks of exposure of cables and infrastructure. Using advanced image analytics, it is possible to convert raw satellite images into quantified information of the seabed around OWFs. The information can either be derived as absolute water depth values in shallow waters (down to 25m), or as relative information highlighting the geomorphological dynamics, such as estimation of migration rates (metres per year) of sand waves.
DHI has successfully delivered this type of information for OWFs along the US east coast, in the North Sea and in Taiwan Strait.
Detailed monitoring of maintenance activities in near-real-time
As most satellites are in constant orbit around the Earth, they provide a mean for getting situational awareness when needed. Optical and radar (SAR) satellites can provide very detailed imagery down to 25 cm in detail level, and with no HSE risks associated. The images are a highly cost-efficient way of getting updated intel on specific OWF sites, allowing monitoring of specific maintenance or similar activities. The images can be delivered within just hours after the acquisition and thus provide the situational overview in near-real-time.
With the increasing amount of satellites, it is now possible to get a daily snapshot in very high resolution of any OWF site in the world. This capacity will be even further increased within the next few years where sub-daily (down to hourly) imagery is expected.
For years, satellite remote sensing data has provided incredible value to metocean processes and characteristics in relation to offshore wind. With the use of altimeters and radar sensors mounted on satellites, it is possible to derive several different parameters related to quantification of metocean conditions, such as winds, waves and sea surface height – today this is even possible very close to a coastline.
Not only is satellite data of significant value for wind resource estimation, it also allows for the establishment of an accurate and robust environmental design basis for building offshore wind turbines.
Today, it is common to apply aggregated measurements from different types of satellites and multiple passes in calibration and validation of numerical hydrodynamics and wave models, the so-called hind cast models – in combination with in situ synoptic observations. The outcome of the hind cast models are accurate time series (typically 30-40 years) of metocean data to be used for planning, design, construction and operation of an offshore wind farm.
Such data is readily available on modern metocean data platforms such as DHI’s MetOcean Data Portal, where long term data can be downloaded easily and quickly for subsequent processing and analysis. Before data (e.g. wave data) is downloaded, the data is always instantly validated against satellite data to assure the quality and robustness.