Urban Heat Islands mapped for Rødovre municipality:
20 May 2019
Our Urban Heat Island data can be found in the Sustainability Report 2019 from Rødovre municipality. The yearly report is part of the municipality’s Agenda 21 strategy, where they use sustainability as the basis for the development of Rødovre.
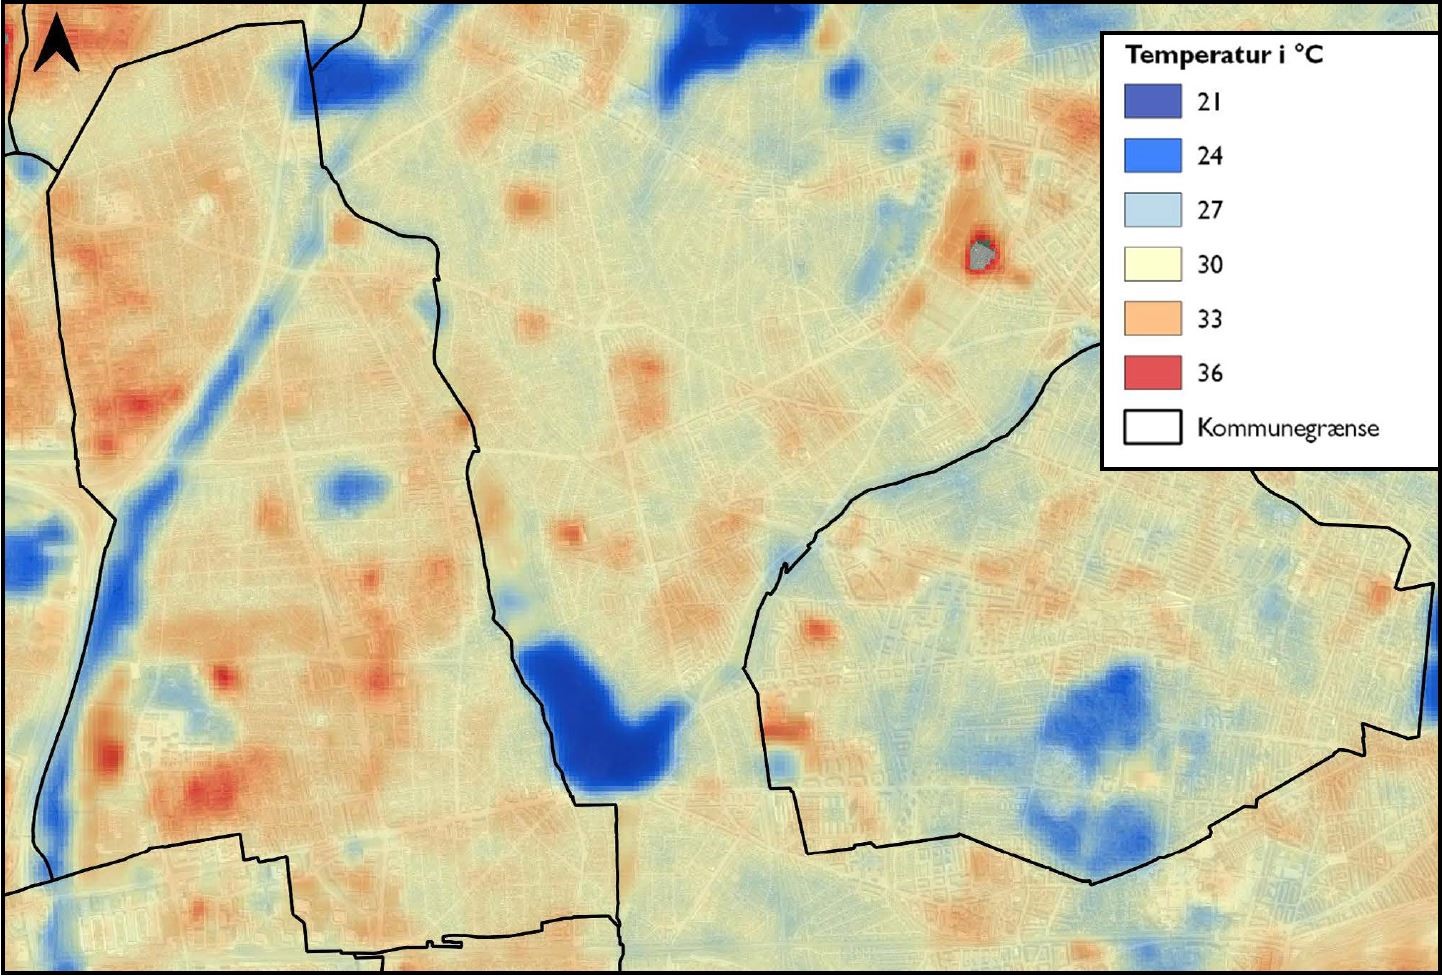
We provided a land surface temperature map, that illustrates the large variance in temperatures across the municipality depending on the urban land use. The map shows a 15 degree difference between some areas, which is dependent on the presence of vegetation and water bodies, due to their “cool down”-effect in contrast to the heating effect from the built-up areas.
We have previously done similar work for the municipality of Copenhagen, where we found a 12 degree difference between areas in the city throughout a very warm and dry summer.
UHIs are a concern in many cities, and known to have significant impacts on the lives of the residents in urban areas as well as the urban environment.
Interested in using satellite data to map Urban Heat Islands for your municipality? Contact us at gras@dhigroup.com
EOatDHI part of the DHI GROUP
gras@dhigroup.com
+45 4516 9100
Agern Alle 5,
2970 Hørsholm,
Denmark
CVR: 36466871